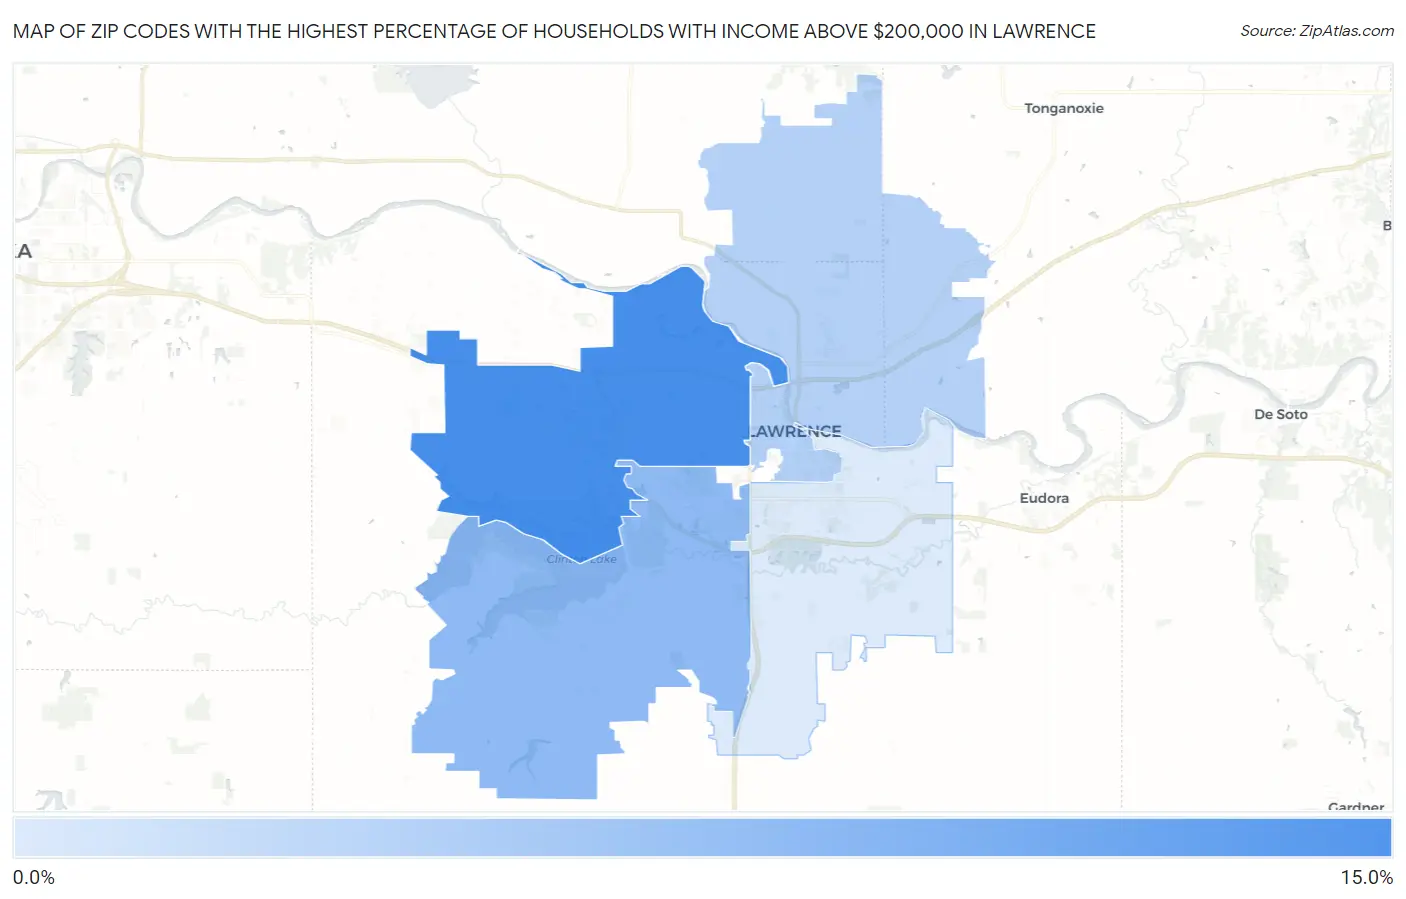
Zip Codes with the Highest Percentage of Households with Income Above $200,000 in Lawrence, KS
RELATED REPORTS & OPTIONS
Household Income | $200k+
Lawrence
Compare Zip Codes
Map of Zip Codes with the Highest Percentage of Households with Income Above $200,000 in Lawrence
2.6%
13.5%
Zip Codes with the Highest Percentage of Households with Income Above $200,000 in Lawrence, KS
| Zip Code | Households with Income > $200k | vs State | vs National | |
| 1. | 66049 | 13.5% | 8.0%(+5.50)#57 | 11.4%(+2.10)#5,731 |
| 2. | 66047 | 8.1% | 8.0%(+0.100)#131 | 11.4%(-3.30)#10,247 |
| 3. | 66044 | 5.5% | 8.0%(-2.50)#226 | 11.4%(-5.90)#14,493 |
| 4. | 66046 | 2.6% | 8.0%(-5.40)#397 | 11.4%(-8.80)#22,038 |
1
Common Questions
What are the Top 3 Zip Codes with the Highest Percentage of Households with Income Above $200,000 in Lawrence, KS?
Top 3 Zip Codes with the Highest Percentage of Households with Income Above $200,000 in Lawrence, KS are:
What zip code has the Highest Percentage of Households with Income Above $200,000 in Lawrence, KS?
66049 has the Highest Percentage of Households with Income Above $200,000 in Lawrence, KS with 13.5%.
What is the Percentage of Households with Income Above $200,000 in Lawrence, KS?
Percentage of Households with Income Above $200,000 in Lawrence is 7.8%.
What is the Percentage of Households with Income Above $200,000 in Kansas?
Percentage of Households with Income Above $200,000 in Kansas is 8.0%.
What is the Percentage of Households with Income Above $200,000 in the United States?
Percentage of Households with Income Above $200,000 in the United States is 11.4%.