Assyrian/Chaldean/Syriac vs Immigrants from Western Europe Median Household Income
COMPARE
Assyrian/Chaldean/Syriac
Immigrants from Western Europe
Median Household Income
Median Household Income Comparison
Assyrians/Chaldeans/Syriacs
Immigrants from Western Europe
$91,991
MEDIAN HOUSEHOLD INCOME
98.8/ 100
METRIC RATING
90th/ 347
METRIC RANK
$91,936
MEDIAN HOUSEHOLD INCOME
98.8/ 100
METRIC RATING
92nd/ 347
METRIC RANK
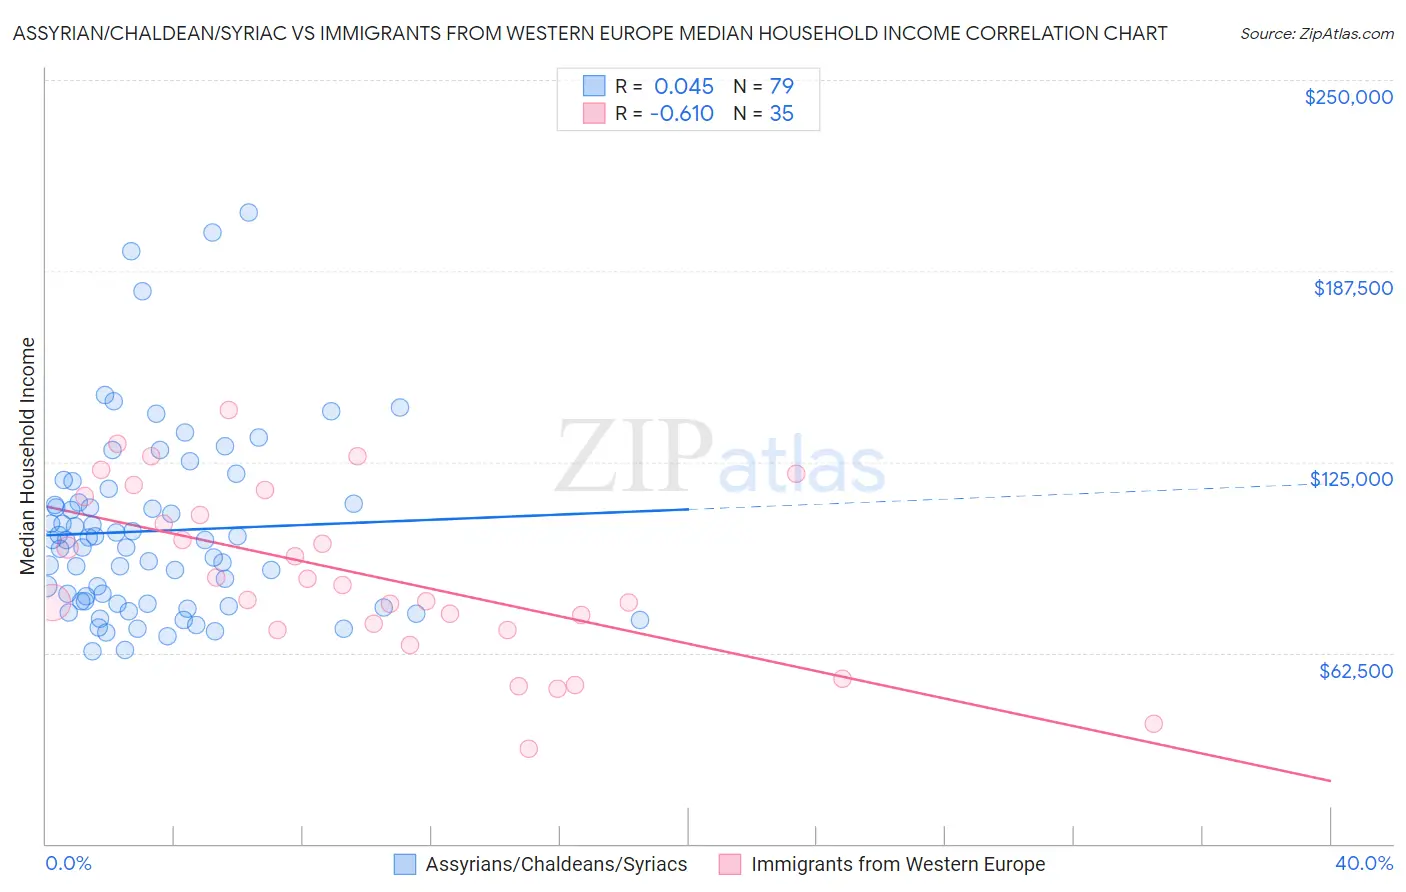
Assyrian/Chaldean/Syriac vs Immigrants from Western Europe Median Household Income Correlation Chart
The statistical analysis conducted on geographies consisting of 110,256,349 people shows no correlation between the proportion of Assyrians/Chaldeans/Syriacs and median household income in the United States with a correlation coefficient (R) of 0.045 and weighted average of $91,991. Similarly, the statistical analysis conducted on geographies consisting of 493,674,241 people shows a significant negative correlation between the proportion of Immigrants from Western Europe and median household income in the United States with a correlation coefficient (R) of -0.610 and weighted average of $91,936, a difference of 0.060%.
Median Household Income Correlation Summary
| Measurement | Assyrian/Chaldean/Syriac | Immigrants from Western Europe |
| Minimum | $63,036 | $31,182 |
| Maximum | $206,750 | $142,061 |
| Range | $143,714 | $110,879 |
| Mean | $102,405 | $87,927 |
| Median | $99,390 | $84,863 |
| Interquartile 25% (IQ1) | $78,587 | $69,977 |
| Interquartile 75% (IQ3) | $111,848 | $113,640 |
| Interquartile Range (IQR) | $33,262 | $43,663 |
| Standard Deviation (Sample) | $30,418 | $27,795 |
| Standard Deviation (Population) | $30,225 | $27,395 |
Demographics Similar to Assyrians/Chaldeans/Syriacs and Immigrants from Western Europe by Median Household Income
In terms of median household income, the demographic groups most similar to Assyrians/Chaldeans/Syriacs are Romanian ($91,994, a difference of 0.0%), Immigrants from Vietnam ($91,987, a difference of 0.0%), Immigrants from Canada ($92,029, a difference of 0.040%), Immigrants from Hungary ($92,094, a difference of 0.11%), and Immigrants from Lebanon ($91,887, a difference of 0.11%). Similarly, the demographic groups most similar to Immigrants from Western Europe are Immigrants from Lebanon ($91,887, a difference of 0.050%), Romanian ($91,994, a difference of 0.060%), Immigrants from Vietnam ($91,987, a difference of 0.060%), Immigrants from North America ($91,860, a difference of 0.080%), and Immigrants from Canada ($92,029, a difference of 0.10%).
| Demographics | Rating | Rank | Median Household Income |
| Immigrants | Eastern Europe | 99.4 /100 | #81 | Exceptional $93,051 |
| Immigrants | Spain | 99.3 /100 | #82 | Exceptional $92,732 |
| Italians | 99.1 /100 | #83 | Exceptional $92,475 |
| Immigrants | Argentina | 99.1 /100 | #84 | Exceptional $92,417 |
| Immigrants | Croatia | 99.0 /100 | #85 | Exceptional $92,225 |
| Immigrants | England | 98.9 /100 | #86 | Exceptional $92,098 |
| Immigrants | Hungary | 98.9 /100 | #87 | Exceptional $92,094 |
| Immigrants | Canada | 98.8 /100 | #88 | Exceptional $92,029 |
| Romanians | 98.8 /100 | #89 | Exceptional $91,994 |
| Assyrians/Chaldeans/Syriacs | 98.8 /100 | #90 | Exceptional $91,991 |
| Immigrants | Vietnam | 98.8 /100 | #91 | Exceptional $91,987 |
| Immigrants | Western Europe | 98.8 /100 | #92 | Exceptional $91,936 |
| Immigrants | Lebanon | 98.7 /100 | #93 | Exceptional $91,887 |
| Immigrants | North America | 98.7 /100 | #94 | Exceptional $91,860 |
| Armenians | 98.7 /100 | #95 | Exceptional $91,807 |
| Jordanians | 98.7 /100 | #96 | Exceptional $91,794 |
| Immigrants | Serbia | 98.6 /100 | #97 | Exceptional $91,730 |
| Immigrants | Southern Europe | 98.5 /100 | #98 | Exceptional $91,605 |
| Immigrants | South Eastern Asia | 98.4 /100 | #99 | Exceptional $91,541 |
| Ukrainians | 98.3 /100 | #100 | Exceptional $91,456 |
| Immigrants | Moldova | 98.3 /100 | #101 | Exceptional $91,446 |