Assyrian/Chaldean/Syriac vs South American Median Household Income
COMPARE
Assyrian/Chaldean/Syriac
South American
Median Household Income
Median Household Income Comparison
Assyrians/Chaldeans/Syriacs
South Americans
$91,991
MEDIAN HOUSEHOLD INCOME
98.8/ 100
METRIC RATING
90th/ 347
METRIC RANK
$86,824
MEDIAN HOUSEHOLD INCOME
75.1/ 100
METRIC RATING
153rd/ 347
METRIC RANK
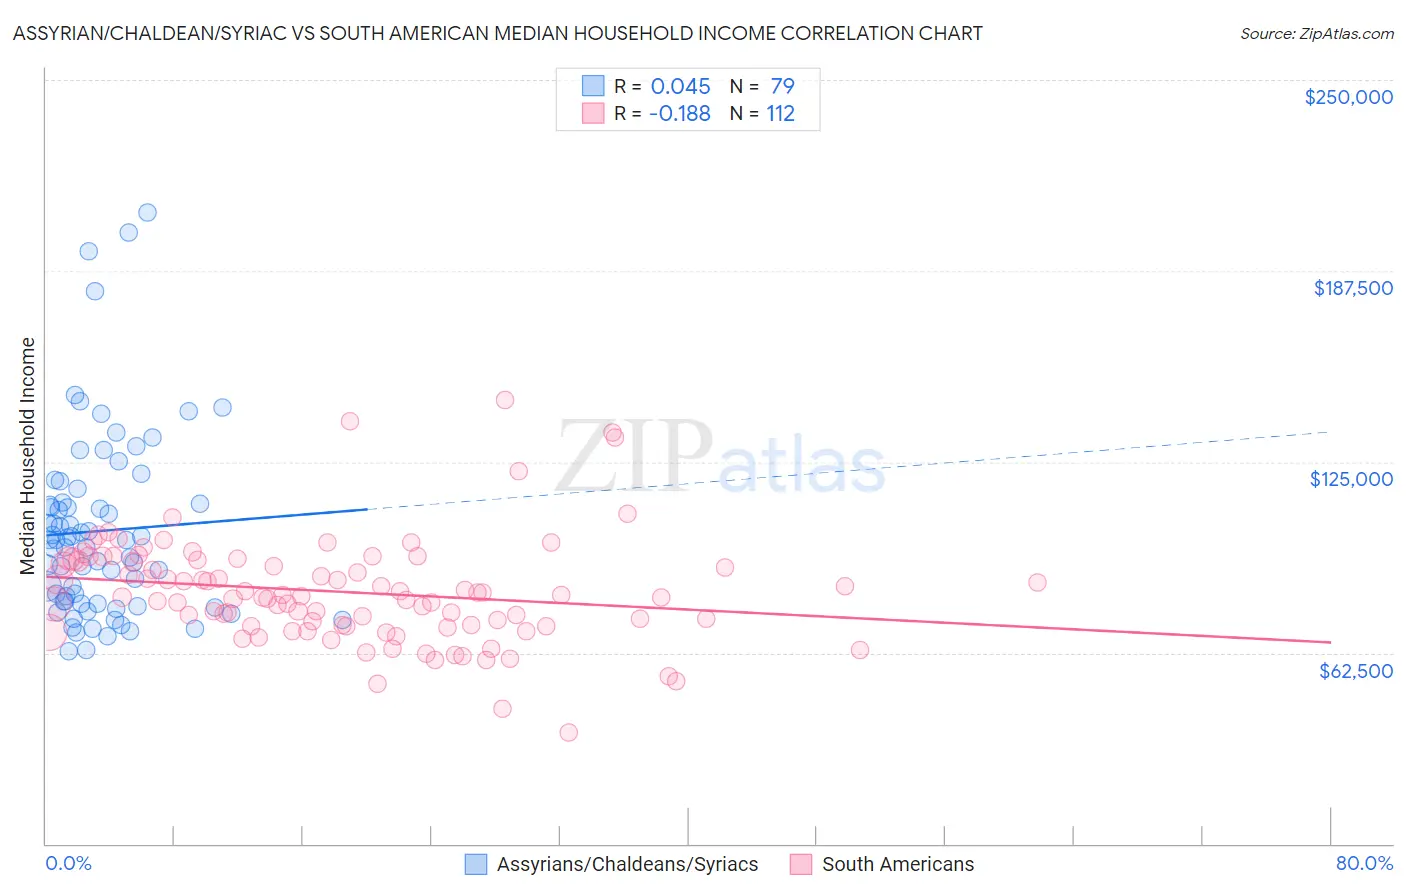
Assyrian/Chaldean/Syriac vs South American Median Household Income Correlation Chart
The statistical analysis conducted on geographies consisting of 110,256,349 people shows no correlation between the proportion of Assyrians/Chaldeans/Syriacs and median household income in the United States with a correlation coefficient (R) of 0.045 and weighted average of $91,991. Similarly, the statistical analysis conducted on geographies consisting of 493,431,068 people shows a poor negative correlation between the proportion of South Americans and median household income in the United States with a correlation coefficient (R) of -0.188 and weighted average of $86,824, a difference of 5.9%.
Median Household Income Correlation Summary
| Measurement | Assyrian/Chaldean/Syriac | South American |
| Minimum | $63,036 | $36,563 |
| Maximum | $206,750 | $145,121 |
| Range | $143,714 | $108,558 |
| Mean | $102,405 | $82,451 |
| Median | $99,390 | $80,811 |
| Interquartile 25% (IQ1) | $78,587 | $71,448 |
| Interquartile 75% (IQ3) | $111,848 | $92,775 |
| Interquartile Range (IQR) | $33,262 | $21,327 |
| Standard Deviation (Sample) | $30,418 | $17,445 |
| Standard Deviation (Population) | $30,225 | $17,367 |
Similar Demographics by Median Household Income
Demographics Similar to Assyrians/Chaldeans/Syriacs by Median Household Income
In terms of median household income, the demographic groups most similar to Assyrians/Chaldeans/Syriacs are Romanian ($91,994, a difference of 0.0%), Immigrants from Vietnam ($91,987, a difference of 0.0%), Immigrants from Canada ($92,029, a difference of 0.040%), Immigrants from Western Europe ($91,936, a difference of 0.060%), and Immigrants from Hungary ($92,094, a difference of 0.11%).
| Demographics | Rating | Rank | Median Household Income |
| Italians | 99.1 /100 | #83 | Exceptional $92,475 |
| Immigrants | Argentina | 99.1 /100 | #84 | Exceptional $92,417 |
| Immigrants | Croatia | 99.0 /100 | #85 | Exceptional $92,225 |
| Immigrants | England | 98.9 /100 | #86 | Exceptional $92,098 |
| Immigrants | Hungary | 98.9 /100 | #87 | Exceptional $92,094 |
| Immigrants | Canada | 98.8 /100 | #88 | Exceptional $92,029 |
| Romanians | 98.8 /100 | #89 | Exceptional $91,994 |
| Assyrians/Chaldeans/Syriacs | 98.8 /100 | #90 | Exceptional $91,991 |
| Immigrants | Vietnam | 98.8 /100 | #91 | Exceptional $91,987 |
| Immigrants | Western Europe | 98.8 /100 | #92 | Exceptional $91,936 |
| Immigrants | Lebanon | 98.7 /100 | #93 | Exceptional $91,887 |
| Immigrants | North America | 98.7 /100 | #94 | Exceptional $91,860 |
| Armenians | 98.7 /100 | #95 | Exceptional $91,807 |
| Jordanians | 98.7 /100 | #96 | Exceptional $91,794 |
| Immigrants | Serbia | 98.6 /100 | #97 | Exceptional $91,730 |
Demographics Similar to South Americans by Median Household Income
In terms of median household income, the demographic groups most similar to South Americans are Immigrants from Saudi Arabia ($86,875, a difference of 0.060%), Immigrants from Germany ($86,764, a difference of 0.070%), Hungarian ($86,920, a difference of 0.11%), Basque ($87,001, a difference of 0.20%), and Carpatho Rusyn ($86,635, a difference of 0.22%).
| Demographics | Rating | Rank | Median Household Income |
| Immigrants | Uganda | 82.8 /100 | #146 | Excellent $87,553 |
| South American Indians | 81.8 /100 | #147 | Excellent $87,446 |
| Costa Ricans | 80.0 /100 | #148 | Excellent $87,262 |
| Immigrants | Nepal | 77.7 /100 | #149 | Good $87,046 |
| Basques | 77.2 /100 | #150 | Good $87,001 |
| Hungarians | 76.3 /100 | #151 | Good $86,920 |
| Immigrants | Saudi Arabia | 75.8 /100 | #152 | Good $86,875 |
| South Americans | 75.1 /100 | #153 | Good $86,824 |
| Immigrants | Germany | 74.4 /100 | #154 | Good $86,764 |
| Carpatho Rusyns | 72.8 /100 | #155 | Good $86,635 |
| Immigrants | Albania | 71.5 /100 | #156 | Good $86,534 |
| Samoans | 71.0 /100 | #157 | Good $86,498 |
| Moroccans | 70.6 /100 | #158 | Good $86,468 |
| Immigrants | Uzbekistan | 70.1 /100 | #159 | Good $86,425 |
| Luxembourgers | 70.0 /100 | #160 | Good $86,418 |