Assyrian/Chaldean/Syriac vs Albanian Median Household Income
COMPARE
Assyrian/Chaldean/Syriac
Albanian
Median Household Income
Median Household Income Comparison
Assyrians/Chaldeans/Syriacs
Albanians
$91,991
MEDIAN HOUSEHOLD INCOME
98.8/ 100
METRIC RATING
90th/ 347
METRIC RANK
$89,744
MEDIAN HOUSEHOLD INCOME
95.2/ 100
METRIC RATING
119th/ 347
METRIC RANK
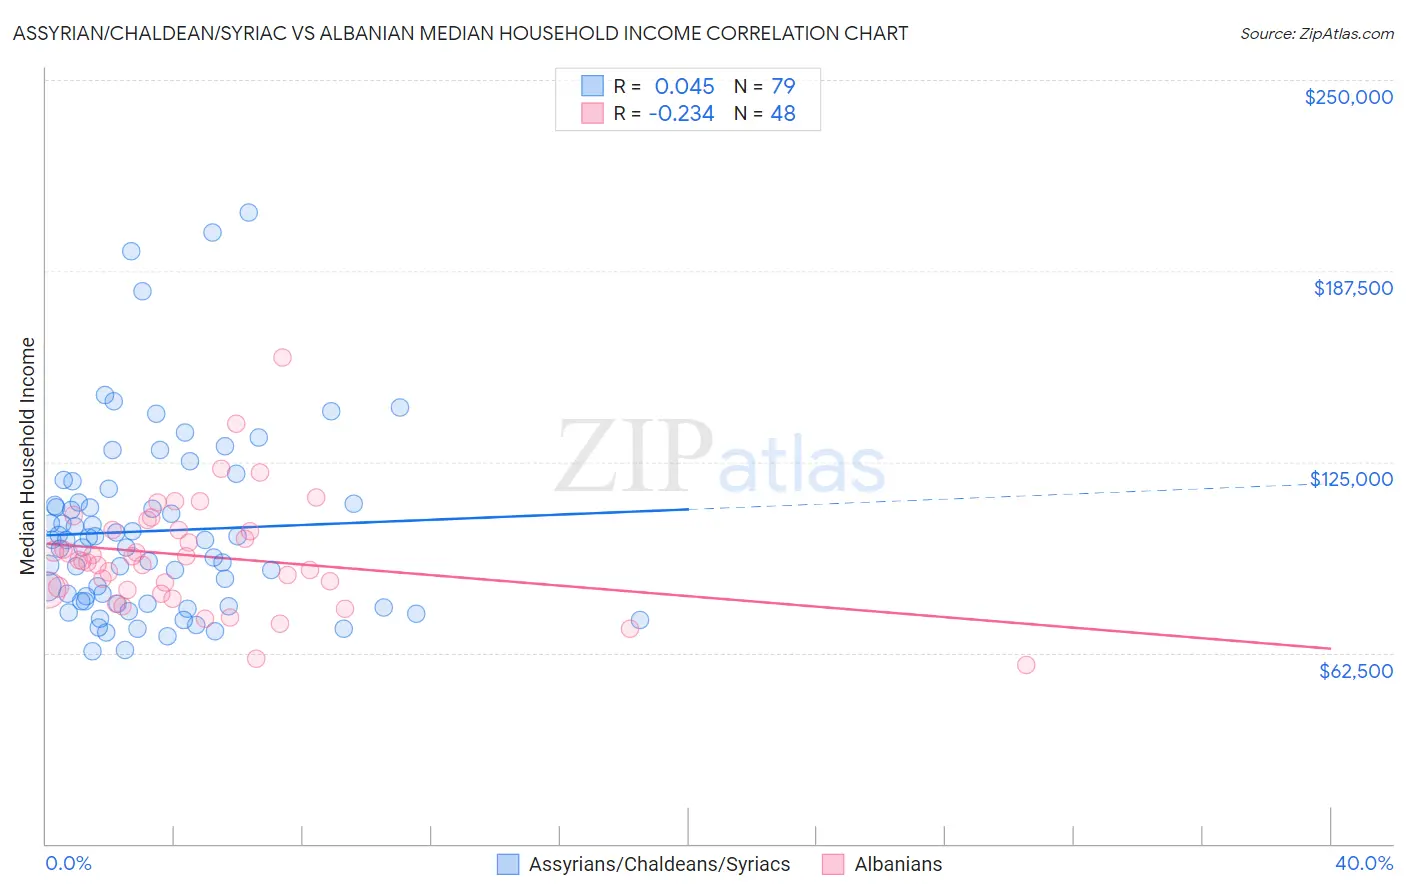
Assyrian/Chaldean/Syriac vs Albanian Median Household Income Correlation Chart
The statistical analysis conducted on geographies consisting of 110,256,349 people shows no correlation between the proportion of Assyrians/Chaldeans/Syriacs and median household income in the United States with a correlation coefficient (R) of 0.045 and weighted average of $91,991. Similarly, the statistical analysis conducted on geographies consisting of 193,153,779 people shows a weak negative correlation between the proportion of Albanians and median household income in the United States with a correlation coefficient (R) of -0.234 and weighted average of $89,744, a difference of 2.5%.
Median Household Income Correlation Summary
| Measurement | Assyrian/Chaldean/Syriac | Albanian |
| Minimum | $63,036 | $58,625 |
| Maximum | $206,750 | $159,242 |
| Range | $143,714 | $100,617 |
| Mean | $102,405 | $94,169 |
| Median | $99,390 | $92,779 |
| Interquartile 25% (IQ1) | $78,587 | $83,032 |
| Interquartile 75% (IQ3) | $111,848 | $102,632 |
| Interquartile Range (IQR) | $33,262 | $19,600 |
| Standard Deviation (Sample) | $30,418 | $18,349 |
| Standard Deviation (Population) | $30,225 | $18,157 |
Similar Demographics by Median Household Income
Demographics Similar to Assyrians/Chaldeans/Syriacs by Median Household Income
In terms of median household income, the demographic groups most similar to Assyrians/Chaldeans/Syriacs are Romanian ($91,994, a difference of 0.0%), Immigrants from Vietnam ($91,987, a difference of 0.0%), Immigrants from Canada ($92,029, a difference of 0.040%), Immigrants from Western Europe ($91,936, a difference of 0.060%), and Immigrants from Hungary ($92,094, a difference of 0.11%).
| Demographics | Rating | Rank | Median Household Income |
| Italians | 99.1 /100 | #83 | Exceptional $92,475 |
| Immigrants | Argentina | 99.1 /100 | #84 | Exceptional $92,417 |
| Immigrants | Croatia | 99.0 /100 | #85 | Exceptional $92,225 |
| Immigrants | England | 98.9 /100 | #86 | Exceptional $92,098 |
| Immigrants | Hungary | 98.9 /100 | #87 | Exceptional $92,094 |
| Immigrants | Canada | 98.8 /100 | #88 | Exceptional $92,029 |
| Romanians | 98.8 /100 | #89 | Exceptional $91,994 |
| Assyrians/Chaldeans/Syriacs | 98.8 /100 | #90 | Exceptional $91,991 |
| Immigrants | Vietnam | 98.8 /100 | #91 | Exceptional $91,987 |
| Immigrants | Western Europe | 98.8 /100 | #92 | Exceptional $91,936 |
| Immigrants | Lebanon | 98.7 /100 | #93 | Exceptional $91,887 |
| Immigrants | North America | 98.7 /100 | #94 | Exceptional $91,860 |
| Armenians | 98.7 /100 | #95 | Exceptional $91,807 |
| Jordanians | 98.7 /100 | #96 | Exceptional $91,794 |
| Immigrants | Serbia | 98.6 /100 | #97 | Exceptional $91,730 |
Demographics Similar to Albanians by Median Household Income
In terms of median household income, the demographic groups most similar to Albanians are Immigrants from North Macedonia ($89,741, a difference of 0.0%), Syrian ($89,830, a difference of 0.10%), Ethiopian ($89,640, a difference of 0.12%), Pakistani ($89,638, a difference of 0.12%), and Taiwanese ($89,900, a difference of 0.17%).
| Demographics | Rating | Rank | Median Household Income |
| Northern Europeans | 96.9 /100 | #112 | Exceptional $90,446 |
| Peruvians | 96.5 /100 | #113 | Exceptional $90,261 |
| Immigrants | Northern Africa | 95.9 /100 | #114 | Exceptional $90,026 |
| Immigrants | Western Asia | 95.9 /100 | #115 | Exceptional $90,005 |
| Native Hawaiians | 95.7 /100 | #116 | Exceptional $89,919 |
| Taiwanese | 95.6 /100 | #117 | Exceptional $89,900 |
| Syrians | 95.4 /100 | #118 | Exceptional $89,830 |
| Albanians | 95.2 /100 | #119 | Exceptional $89,744 |
| Immigrants | North Macedonia | 95.2 /100 | #120 | Exceptional $89,741 |
| Ethiopians | 94.9 /100 | #121 | Exceptional $89,640 |
| Pakistanis | 94.8 /100 | #122 | Exceptional $89,638 |
| Immigrants | Zimbabwe | 94.4 /100 | #123 | Exceptional $89,496 |
| Immigrants | Jordan | 94.1 /100 | #124 | Exceptional $89,412 |
| Immigrants | Kuwait | 93.5 /100 | #125 | Exceptional $89,263 |
| Immigrants | Oceania | 92.9 /100 | #126 | Exceptional $89,100 |