White/Caucasian vs Norwegian Householder Income Over 65 years
COMPARE
White/Caucasian
Norwegian
Householder Income Over 65 years
Householder Income Over 65 years Comparison
Whites/Caucasians
Norwegians
$58,847
HOUSEHOLDER INCOME OVER 65 YEARS
9.8/ 100
METRIC RATING
213th/ 347
METRIC RANK
$61,104
HOUSEHOLDER INCOME OVER 65 YEARS
53.6/ 100
METRIC RATING
167th/ 347
METRIC RANK
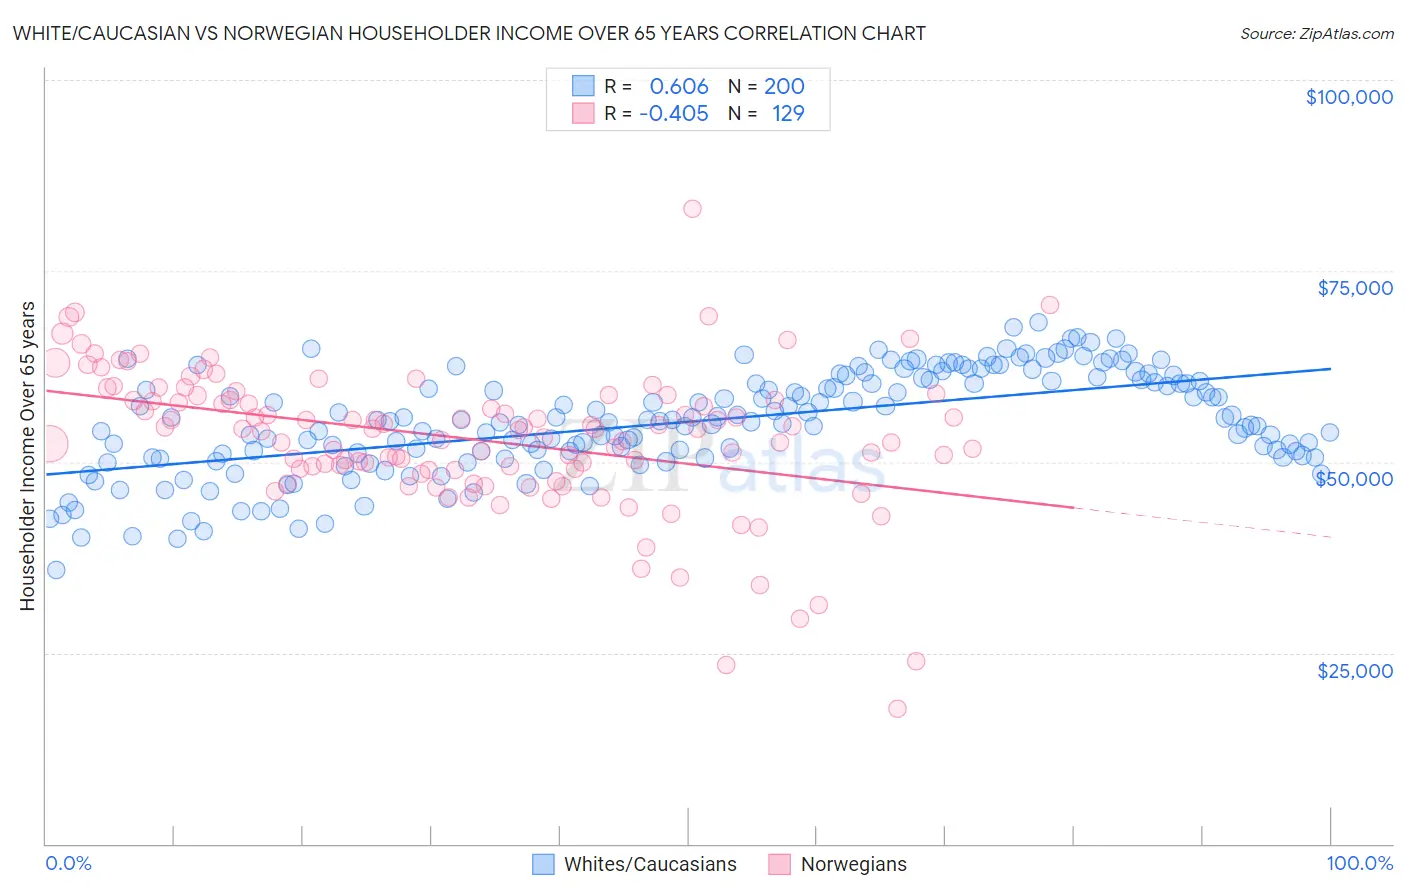
White/Caucasian vs Norwegian Householder Income Over 65 years Correlation Chart
The statistical analysis conducted on geographies consisting of 577,509,844 people shows a significant positive correlation between the proportion of Whites/Caucasians and household income with householder over the age of 65 in the United States with a correlation coefficient (R) of 0.606 and weighted average of $58,847. Similarly, the statistical analysis conducted on geographies consisting of 529,627,922 people shows a moderate negative correlation between the proportion of Norwegians and household income with householder over the age of 65 in the United States with a correlation coefficient (R) of -0.405 and weighted average of $61,104, a difference of 3.8%.
Householder Income Over 65 years Correlation Summary
| Measurement | White/Caucasian | Norwegian |
| Minimum | $35,837 | $17,624 |
| Maximum | $68,217 | $83,083 |
| Range | $32,380 | $65,458 |
| Mean | $55,258 | $53,000 |
| Median | $55,418 | $54,270 |
| Interquartile 25% (IQ1) | $51,091 | $49,000 |
| Interquartile 75% (IQ3) | $60,670 | $58,423 |
| Interquartile Range (IQR) | $9,580 | $9,422 |
| Standard Deviation (Sample) | $6,600 | $9,391 |
| Standard Deviation (Population) | $6,583 | $9,355 |
Similar Demographics by Householder Income Over 65 years
Demographics Similar to Whites/Caucasians by Householder Income Over 65 years
In terms of householder income over 65 years, the demographic groups most similar to Whites/Caucasians are Colombian ($58,851, a difference of 0.010%), Nepalese ($58,761, a difference of 0.15%), Immigrants from Nigeria ($58,942, a difference of 0.16%), Nigerian ($58,992, a difference of 0.25%), and Slovak ($59,039, a difference of 0.33%).
| Demographics | Rating | Rank | Householder Income Over 65 years |
| Immigrants | South America | 13.0 /100 | #206 | Poor $59,151 |
| Salvadorans | 12.9 /100 | #207 | Poor $59,141 |
| Uruguayans | 12.3 /100 | #208 | Poor $59,090 |
| Slovaks | 11.7 /100 | #209 | Poor $59,039 |
| Nigerians | 11.2 /100 | #210 | Poor $58,992 |
| Immigrants | Nigeria | 10.7 /100 | #211 | Poor $58,942 |
| Colombians | 9.8 /100 | #212 | Tragic $58,851 |
| Whites/Caucasians | 9.8 /100 | #213 | Tragic $58,847 |
| Nepalese | 9.0 /100 | #214 | Tragic $58,761 |
| Immigrants | Ghana | 7.9 /100 | #215 | Tragic $58,624 |
| Immigrants | Middle Africa | 6.2 /100 | #216 | Tragic $58,375 |
| Sudanese | 5.7 /100 | #217 | Tragic $58,281 |
| Panamanians | 5.6 /100 | #218 | Tragic $58,266 |
| Malaysians | 5.5 /100 | #219 | Tragic $58,244 |
| Yugoslavians | 5.5 /100 | #220 | Tragic $58,243 |
Demographics Similar to Norwegians by Householder Income Over 65 years
In terms of householder income over 65 years, the demographic groups most similar to Norwegians are Irish ($61,097, a difference of 0.010%), Carpatho Rusyn ($61,093, a difference of 0.020%), Serbian ($61,087, a difference of 0.030%), Inupiat ($61,061, a difference of 0.070%), and Immigrants from Eastern Africa ($61,157, a difference of 0.090%).
| Demographics | Rating | Rank | Householder Income Over 65 years |
| Portuguese | 62.1 /100 | #160 | Good $61,440 |
| Icelanders | 57.9 /100 | #161 | Average $61,270 |
| Czechs | 57.2 /100 | #162 | Average $61,244 |
| Ugandans | 55.5 /100 | #163 | Average $61,177 |
| Immigrants | North Macedonia | 55.4 /100 | #164 | Average $61,175 |
| Immigrants | Ukraine | 55.1 /100 | #165 | Average $61,163 |
| Immigrants | Eastern Africa | 55.0 /100 | #166 | Average $61,157 |
| Norwegians | 53.6 /100 | #167 | Average $61,104 |
| Irish | 53.4 /100 | #168 | Average $61,097 |
| Carpatho Rusyns | 53.3 /100 | #169 | Average $61,093 |
| Serbians | 53.1 /100 | #170 | Average $61,087 |
| Inupiat | 52.4 /100 | #171 | Average $61,061 |
| Immigrants | Poland | 51.9 /100 | #172 | Average $61,041 |
| Immigrants | Micronesia | 50.8 /100 | #173 | Average $61,000 |
| Luxembourgers | 50.0 /100 | #174 | Average $60,967 |