White/Caucasian vs Swiss Householder Income Over 65 years
COMPARE
White/Caucasian
Swiss
Householder Income Over 65 years
Householder Income Over 65 years Comparison
Whites/Caucasians
Swiss
$58,847
HOUSEHOLDER INCOME OVER 65 YEARS
9.8/ 100
METRIC RATING
213th/ 347
METRIC RANK
$61,621
HOUSEHOLDER INCOME OVER 65 YEARS
66.5/ 100
METRIC RATING
154th/ 347
METRIC RANK
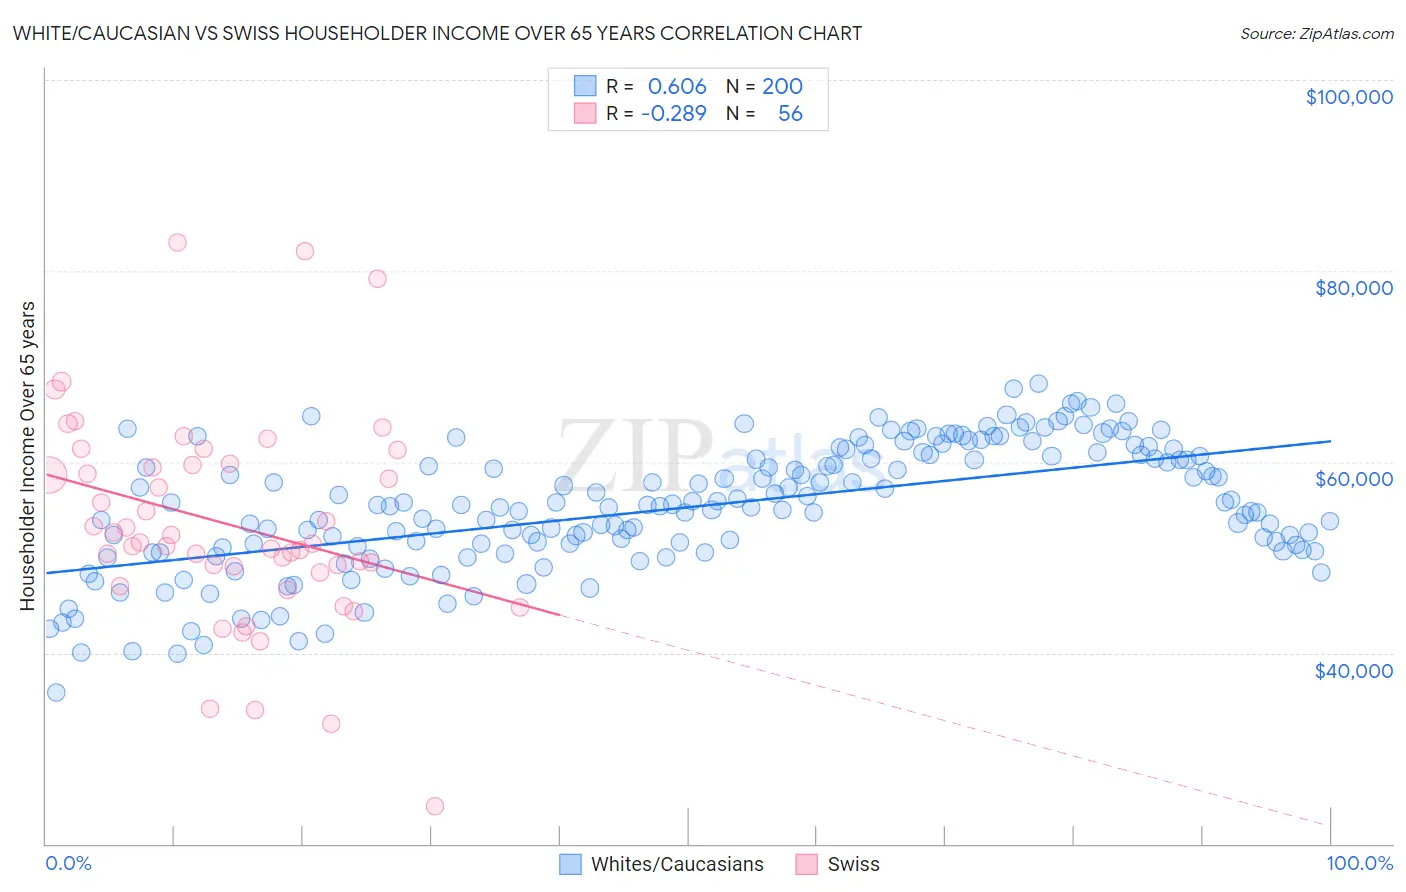
White/Caucasian vs Swiss Householder Income Over 65 years Correlation Chart
The statistical analysis conducted on geographies consisting of 577,509,844 people shows a significant positive correlation between the proportion of Whites/Caucasians and household income with householder over the age of 65 in the United States with a correlation coefficient (R) of 0.606 and weighted average of $58,847. Similarly, the statistical analysis conducted on geographies consisting of 463,196,243 people shows a weak negative correlation between the proportion of Swiss and household income with householder over the age of 65 in the United States with a correlation coefficient (R) of -0.289 and weighted average of $61,621, a difference of 4.7%.
Householder Income Over 65 years Correlation Summary
| Measurement | White/Caucasian | Swiss |
| Minimum | $35,837 | $23,899 |
| Maximum | $68,217 | $83,019 |
| Range | $32,380 | $59,120 |
| Mean | $55,258 | $53,433 |
| Median | $55,418 | $51,480 |
| Interquartile 25% (IQ1) | $51,091 | $48,765 |
| Interquartile 75% (IQ3) | $60,670 | $59,727 |
| Interquartile Range (IQR) | $9,580 | $10,962 |
| Standard Deviation (Sample) | $6,600 | $11,086 |
| Standard Deviation (Population) | $6,583 | $10,986 |
Similar Demographics by Householder Income Over 65 years
Demographics Similar to Whites/Caucasians by Householder Income Over 65 years
In terms of householder income over 65 years, the demographic groups most similar to Whites/Caucasians are Colombian ($58,851, a difference of 0.010%), Nepalese ($58,761, a difference of 0.15%), Immigrants from Nigeria ($58,942, a difference of 0.16%), Nigerian ($58,992, a difference of 0.25%), and Slovak ($59,039, a difference of 0.33%).
| Demographics | Rating | Rank | Householder Income Over 65 years |
| Immigrants | South America | 13.0 /100 | #206 | Poor $59,151 |
| Salvadorans | 12.9 /100 | #207 | Poor $59,141 |
| Uruguayans | 12.3 /100 | #208 | Poor $59,090 |
| Slovaks | 11.7 /100 | #209 | Poor $59,039 |
| Nigerians | 11.2 /100 | #210 | Poor $58,992 |
| Immigrants | Nigeria | 10.7 /100 | #211 | Poor $58,942 |
| Colombians | 9.8 /100 | #212 | Tragic $58,851 |
| Whites/Caucasians | 9.8 /100 | #213 | Tragic $58,847 |
| Nepalese | 9.0 /100 | #214 | Tragic $58,761 |
| Immigrants | Ghana | 7.9 /100 | #215 | Tragic $58,624 |
| Immigrants | Middle Africa | 6.2 /100 | #216 | Tragic $58,375 |
| Sudanese | 5.7 /100 | #217 | Tragic $58,281 |
| Panamanians | 5.6 /100 | #218 | Tragic $58,266 |
| Malaysians | 5.5 /100 | #219 | Tragic $58,244 |
| Yugoslavians | 5.5 /100 | #220 | Tragic $58,243 |
Demographics Similar to Swiss by Householder Income Over 65 years
In terms of householder income over 65 years, the demographic groups most similar to Swiss are Costa Rican ($61,638, a difference of 0.030%), Polish ($61,598, a difference of 0.040%), Armenian ($61,656, a difference of 0.060%), Scandinavian ($61,586, a difference of 0.060%), and Hungarian ($61,673, a difference of 0.080%).
| Demographics | Rating | Rank | Householder Income Over 65 years |
| Immigrants | Nepal | 71.4 /100 | #147 | Good $61,843 |
| Alsatians | 70.5 /100 | #148 | Good $61,797 |
| Scottish | 69.1 /100 | #149 | Good $61,735 |
| Slavs | 68.5 /100 | #150 | Good $61,709 |
| Hungarians | 67.7 /100 | #151 | Good $61,673 |
| Armenians | 67.3 /100 | #152 | Good $61,656 |
| Costa Ricans | 66.9 /100 | #153 | Good $61,638 |
| Swiss | 66.5 /100 | #154 | Good $61,621 |
| Poles | 65.9 /100 | #155 | Good $61,598 |
| Scandinavians | 65.6 /100 | #156 | Good $61,586 |
| Macedonians | 65.1 /100 | #157 | Good $61,564 |
| English | 63.3 /100 | #158 | Good $61,487 |
| Brazilians | 62.7 /100 | #159 | Good $61,465 |
| Portuguese | 62.1 /100 | #160 | Good $61,440 |
| Icelanders | 57.9 /100 | #161 | Average $61,270 |