White/Caucasian vs Australian Householder Income Over 65 years

COMPARE

White/Caucasian
Race
Ancestry
AfghanAfricanAlaska NativeAlaskan AthabascanAlbanianAleutAlsatianAmericanApacheArabArapahoArgentineanArmenianAssyrian/Chaldean/SyriacAustrianBahamianBangladeshiBarbadianBasqueBelgianBelizeanBermudanBhutaneseBlackfeetBolivianBrazilianBritishBritish West IndianBulgarianBurmeseCajunCambodianCanadianCape VerdeanCarpatho RusynCelticCentral AmericanCentral American IndianCherokeeCheyenneChickasawChileanChineseChippewaChoctawColombianColvilleComancheCosta RicanCreeCreekCroatianCrowCubanCypriotCzechCzechoslovakianDanishDelawareDominicanDutchDutch West IndianEastern EuropeanEcuadorianEgyptianEnglishEstonianEthiopianEuropeanFijianFilipinoFinnishFrenchFrench American IndianFrench CanadianGermanGerman RussianGhanaianGreekGuamanian/ChamorroGuatemalanGuyaneseHaitianHmongHonduranHopiHoumaHungarianIcelanderIndian (Asian)IndonesianInupiatIranianIraqiIrishIroquoisIsraeliItalianJamaicanJapaneseJordanianKenyanKiowaKoreanLaotianLatvianLebaneseLiberianLithuanianLumbeeLuxembourgerMacedonianMalaysianMalteseMarshalleseMenomineeMexicanMexican American IndianMongolianMoroccanNative HawaiianNavajoNepaleseNew ZealanderNicaraguanNigerianNorthern EuropeanNorwegianOkinawanOsageOttawaPaiutePakistaniPalestinianPanamanianParaguayanPennsylvania GermanPeruvianPimaPolishPortuguesePotawatomiPuebloPuerto RicanPuget Sound SalishRomanianRussianSalvadoranSamoanScandinavianScotch-IrishScottishSeminoleSenegaleseSerbianShoshoneSierra LeoneanSiouxSlavicSlovakSloveneSomaliSouth AfricanSouth AmericanSouth American IndianSoviet UnionSpaniardSpanishSpanish AmericanSpanish American IndianSri LankanSubsaharan AfricanSudaneseSwedishSwissSyrianTaiwaneseThaiTlingit-HaidaTohono O'OdhamTonganTrinidadian and TobagonianTsimshianTurkishU.S. Virgin IslanderUgandanUkrainianUruguayanUteVenezuelanVietnameseWelshWest IndianYakamaYaquiYugoslavianYumanYup'ikZimbabwean
Immigration
NonimmigrantsImmigrantsAfghanistanAfricaAlbaniaArgentinaArmeniaAsiaAustraliaAustriaBahamasBangladeshBarbadosBelarusBelgiumBelizeBoliviaBosnia and HerzegovinaBrazilBulgariaBurma/MyanmarCabo VerdeCambodiaCameroonCanadaCaribbeanCentral AmericaChileChinaColombiaCongoCosta RicaCroatiaCubaCzechoslovakiaDenmarkDominicaDominican RepublicEastern AfricaEastern AsiaEastern EuropeEcuadorEgyptEl SalvadorEnglandEritreaEthiopiaEuropeFijiFranceGermanyGhanaGreeceGrenadaGuatemalaGuyanaHaitiHondurasHong KongHungaryIndiaIndonesiaIranIraqIrelandIsraelItalyJamaicaJapanJordanKazakhstanKenyaKoreaKuwaitLaosLatin AmericaLatviaLebanonLiberiaLithuaniaMalaysiaMexicoMicronesiaMiddle AfricaMoldovaMoroccoNepalNetherlandsNicaraguaNigeriaNorth AmericaNorth MacedoniaNorthern AfricaNorthern EuropeNorwayOceaniaPakistanPanamaPeruPhilippinesPolandPortugalRomaniaRussiaSaudi ArabiaScotlandSenegalSerbiaSierra LeoneSingaporeSomaliaSouth AfricaSouth AmericaSouth Central AsiaSouth Eastern AsiaSouthern EuropeSpainSri LankaSt. Vincent and the GrenadinesSudanSwedenSwitzerlandSyriaTaiwanThailandTrinidad and TobagoTurkeyUgandaUkraineUruguayUzbekistanVenezuelaVietnamWest IndiesWestern AfricaWestern AsiaWestern EuropeYemenZaireZimbabweAzores
Australian
Race
Ancestry
AfghanAfricanAlaska NativeAlaskan AthabascanAlbanianAleutAlsatianAmericanApacheArabArapahoArgentineanArmenianAssyrian/Chaldean/SyriacAustralianAustrianBahamianBangladeshiBarbadianBasqueBelgianBelizeanBermudanBhutaneseBlackfeetBolivianBrazilianBritishBritish West IndianBulgarianBurmeseCajunCambodianCanadianCape VerdeanCarpatho RusynCelticCentral AmericanCentral American IndianCherokeeCheyenneChickasawChileanChineseChippewaChoctawColombianColvilleComancheCosta RicanCreeCreekCroatianCrowCubanCypriotCzechCzechoslovakianDanishDelawareDominicanDutchDutch West IndianEastern EuropeanEcuadorianEgyptianEnglishEstonianEthiopianEuropeanFijianFilipinoFinnishFrenchFrench American IndianFrench CanadianGermanGerman RussianGhanaianGreekGuamanian/ChamorroGuatemalanGuyaneseHaitianHmongHonduranHopiHoumaHungarianIcelanderIndian (Asian)IndonesianInupiatIranianIraqiIrishIroquoisIsraeliItalianJamaicanJapaneseJordanianKenyanKiowaKoreanLaotianLatvianLebaneseLiberianLithuanianLumbeeLuxembourgerMacedonianMalaysianMalteseMarshalleseMenomineeMexicanMexican American IndianMongolianMoroccanNative HawaiianNavajoNepaleseNew ZealanderNicaraguanNigerianNorthern EuropeanNorwegianOkinawanOsageOttawaPaiutePakistaniPalestinianPanamanianParaguayanPennsylvania GermanPeruvianPimaPolishPortuguesePotawatomiPuebloPuerto RicanPuget Sound SalishRomanianRussianSalvadoranSamoanScandinavianScotch-IrishScottishSeminoleSenegaleseSerbianShoshoneSierra LeoneanSiouxSlavicSlovakSloveneSomaliSouth AfricanSouth AmericanSouth American IndianSoviet UnionSpaniardSpanishSpanish AmericanSpanish American IndianSri LankanSubsaharan AfricanSudaneseSwedishSwissSyrianTaiwaneseThaiTlingit-HaidaTohono O'OdhamTonganTrinidadian and TobagonianTsimshianTurkishU.S. Virgin IslanderUgandanUkrainianUruguayanUteVenezuelanVietnameseWelshWest IndianYakamaYaquiYugoslavianYumanYup'ikZimbabwean
Immigration
NonimmigrantsImmigrantsAfghanistanAfricaAlbaniaArgentinaArmeniaAsiaAustraliaAustriaBahamasBangladeshBarbadosBelarusBelgiumBelizeBoliviaBosnia and HerzegovinaBrazilBulgariaBurma/MyanmarCabo VerdeCambodiaCameroonCanadaCaribbeanCentral AmericaChileChinaColombiaCongoCosta RicaCroatiaCubaCzechoslovakiaDenmarkDominicaDominican RepublicEastern AfricaEastern AsiaEastern EuropeEcuadorEgyptEl SalvadorEnglandEritreaEthiopiaEuropeFijiFranceGermanyGhanaGreeceGrenadaGuatemalaGuyanaHaitiHondurasHong KongHungaryIndiaIndonesiaIranIraqIrelandIsraelItalyJamaicaJapanJordanKazakhstanKenyaKoreaKuwaitLaosLatin AmericaLatviaLebanonLiberiaLithuaniaMalaysiaMexicoMicronesiaMiddle AfricaMoldovaMoroccoNepalNetherlandsNicaraguaNigeriaNorth AmericaNorth MacedoniaNorthern AfricaNorthern EuropeNorwayOceaniaPakistanPanamaPeruPhilippinesPolandPortugalRomaniaRussiaSaudi ArabiaScotlandSenegalSerbiaSierra LeoneSingaporeSomaliaSouth AfricaSouth AmericaSouth Central AsiaSouth Eastern AsiaSouthern EuropeSpainSri LankaSt. Vincent and the GrenadinesSudanSwedenSwitzerlandSyriaTaiwanThailandTrinidad and TobagoTurkeyUgandaUkraineUruguayUzbekistanVenezuelaVietnamWest IndiesWestern AfricaWestern AsiaWestern EuropeYemenZaireZimbabweAzores
Householder Income Over 65 years
Income
Poverty
Unemployment
Labor Participation
Family Structure
Vehicle Availability
Education Level
Disability

Householder Income Over 65 years Comparison

Whites/Caucasians

Australians

Tragic
Exceptional
$58,847
HOUSEHOLDER INCOME OVER 65 YEARS
9.8/ 100
METRIC RATING
213th/ 347
METRIC RANK
$66,891
HOUSEHOLDER INCOME OVER 65 YEARS
99.8/ 100
METRIC RATING
47th/ 347
METRIC RANK

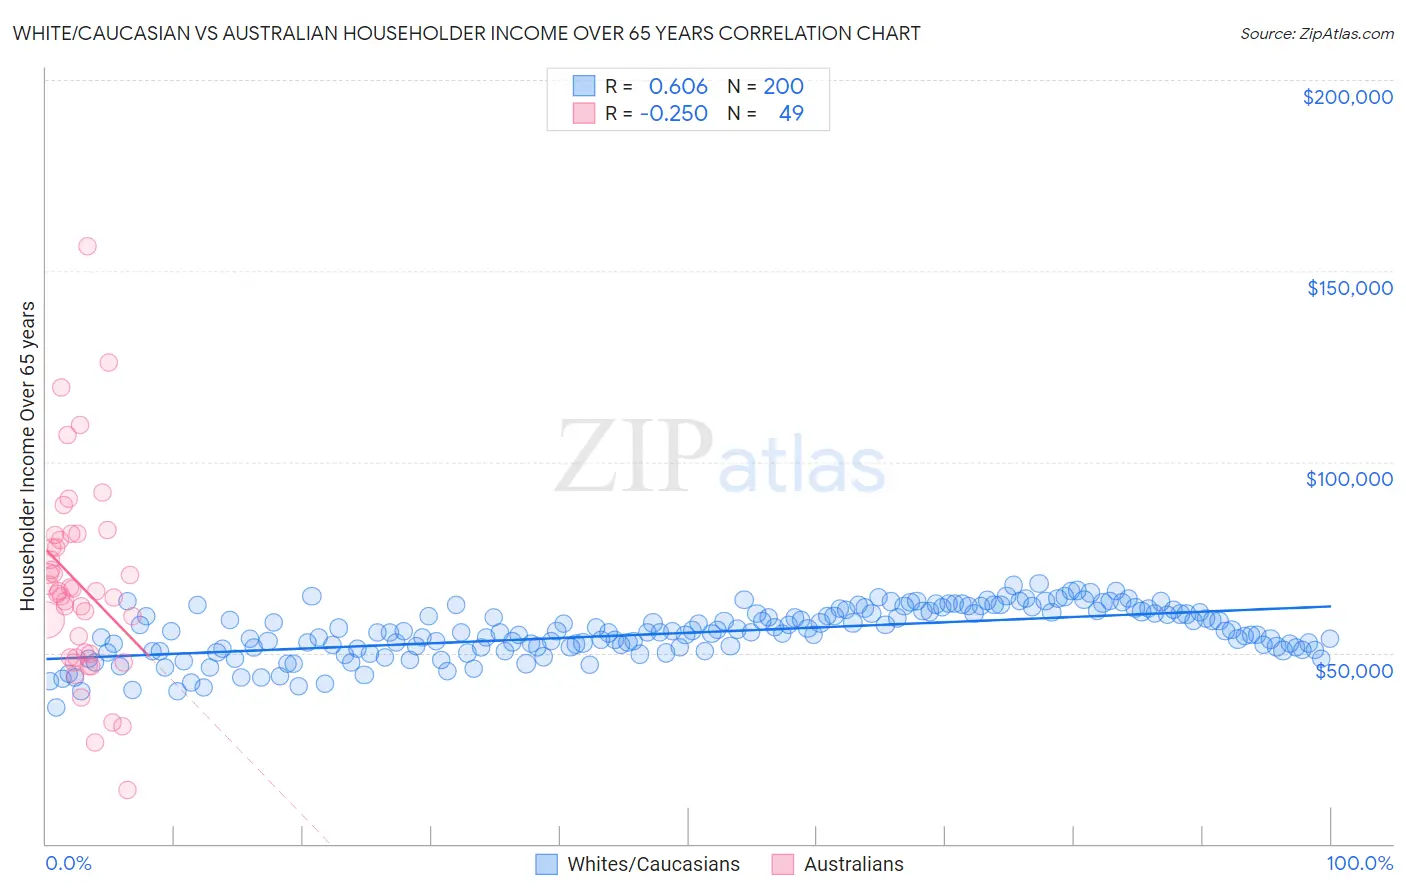
White/Caucasian vs Australian Householder Income Over 65 years Correlation Chart

The statistical analysis conducted on geographies consisting of 577,509,844 people shows a significant positive correlation between the proportion of Whites/Caucasians and household income with householder over the age of 65 in the United States with a correlation coefficient (R) of 0.606 and weighted average of $58,847. Similarly, the statistical analysis conducted on geographies consisting of 223,634,987 people shows a weak negative correlation between the proportion of Australians and household income with householder over the age of 65 in the United States with a correlation coefficient (R) of -0.250 and weighted average of $66,891, a difference of 13.7%.
White/Caucasian vs Australian Householder Income Over 65 years

Householder Income Over 65 years Correlation Summary

MeasurementWhite/CaucasianAustralian
Minimum$35,837$13,929
Maximum$68,217$156,341
Range$32,380$142,412
Mean$55,258$67,933
Median$55,418$66,111
Interquartile 25% (IQ1)$51,091$49,254
Interquartile 75% (IQ3)$60,670$80,198
Interquartile Range (IQR)$9,580$30,944
Standard Deviation (Sample)$6,600$25,877
Standard Deviation (Population)$6,583$25,612

Similar Demographics by Householder Income Over 65 years

Demographics Similar to Whites/Caucasians by Householder Income Over 65 years

In terms of householder income over 65 years, the demographic groups most similar to Whites/Caucasians are Colombian ($58,851, a difference of 0.010%), Nepalese ($58,761, a difference of 0.15%), Immigrants from Nigeria ($58,942, a difference of 0.16%), Nigerian ($58,992, a difference of 0.25%), and Slovak ($59,039, a difference of 0.33%).
DemographicsRating | RankHouseholder Income Over 65 years
Immigrants | South America
13.0
/100
|
#206
Poor
$59,151
Salvadorans
12.9
/100
|
#207
Poor
$59,141
Uruguayans
12.3
/100
|
#208
Poor
$59,090
Slovaks
11.7
/100
|
#209
Poor
$59,039
Nigerians
11.2
/100
|
#210
Poor
$58,992
Immigrants | Nigeria
10.7
/100
|
#211
Poor
$58,942
Colombians
9.8
/100
|
#212
Tragic
$58,851
Whites/Caucasians
9.8
/100
|
#213
Tragic
$58,847
Nepalese
9.0
/100
|
#214
Tragic
$58,761
Immigrants | Ghana
7.9
/100
|
#215
Tragic
$58,624
Immigrants | Middle Africa
6.2
/100
|
#216
Tragic
$58,375
Sudanese
5.7
/100
|
#217
Tragic
$58,281
Panamanians
5.6
/100
|
#218
Tragic
$58,266
Malaysians
5.5
/100
|
#219
Tragic
$58,244
Yugoslavians
5.5
/100
|
#220
Tragic
$58,243

Demographics Similar to Australians by Householder Income Over 65 years

In terms of householder income over 65 years, the demographic groups most similar to Australians are Cambodian ($66,892, a difference of 0.0%), Immigrants from France ($66,826, a difference of 0.10%), Immigrants from Afghanistan ($67,007, a difference of 0.17%), Immigrants from Indonesia ($66,694, a difference of 0.29%), and Immigrants from Turkey ($66,672, a difference of 0.33%).
DemographicsRating | RankHouseholder Income Over 65 years
Immigrants | Asia
99.9
/100
|
#40
Exceptional
$67,594
Koreans
99.9
/100
|
#41
Exceptional
$67,472
New Zealanders
99.9
/100
|
#42
Exceptional
$67,333
Latvians
99.9
/100
|
#43
Exceptional
$67,326
Immigrants | South Africa
99.9
/100
|
#44
Exceptional
$67,234
Immigrants | Afghanistan
99.8
/100
|
#45
Exceptional
$67,007
Cambodians
99.8
/100
|
#46
Exceptional
$66,892
Australians
99.8
/100
|
#47
Exceptional
$66,891
Immigrants | France
99.8
/100
|
#48
Exceptional
$66,826
Immigrants | Indonesia
99.8
/100
|
#49
Exceptional
$66,694
Immigrants | Turkey
99.7
/100
|
#50
Exceptional
$66,672
Israelis
99.7
/100
|
#51
Exceptional
$66,636
Immigrants | Scotland
99.7
/100
|
#52
Exceptional
$66,620
Immigrants | Pakistan
99.7
/100
|
#53
Exceptional
$66,617
Immigrants | Netherlands
99.7
/100
|
#54
Exceptional
$66,463