Immigrants from Fiji vs Crow Householder Income Over 65 years
COMPARE
Immigrants from Fiji
Crow
Householder Income Over 65 years
Householder Income Over 65 years Comparison
Immigrants from Fiji
Crow
$64,795
HOUSEHOLDER INCOME OVER 65 YEARS
98.2/ 100
METRIC RATING
82nd/ 347
METRIC RANK
$49,234
HOUSEHOLDER INCOME OVER 65 YEARS
0.0/ 100
METRIC RATING
335th/ 347
METRIC RANK
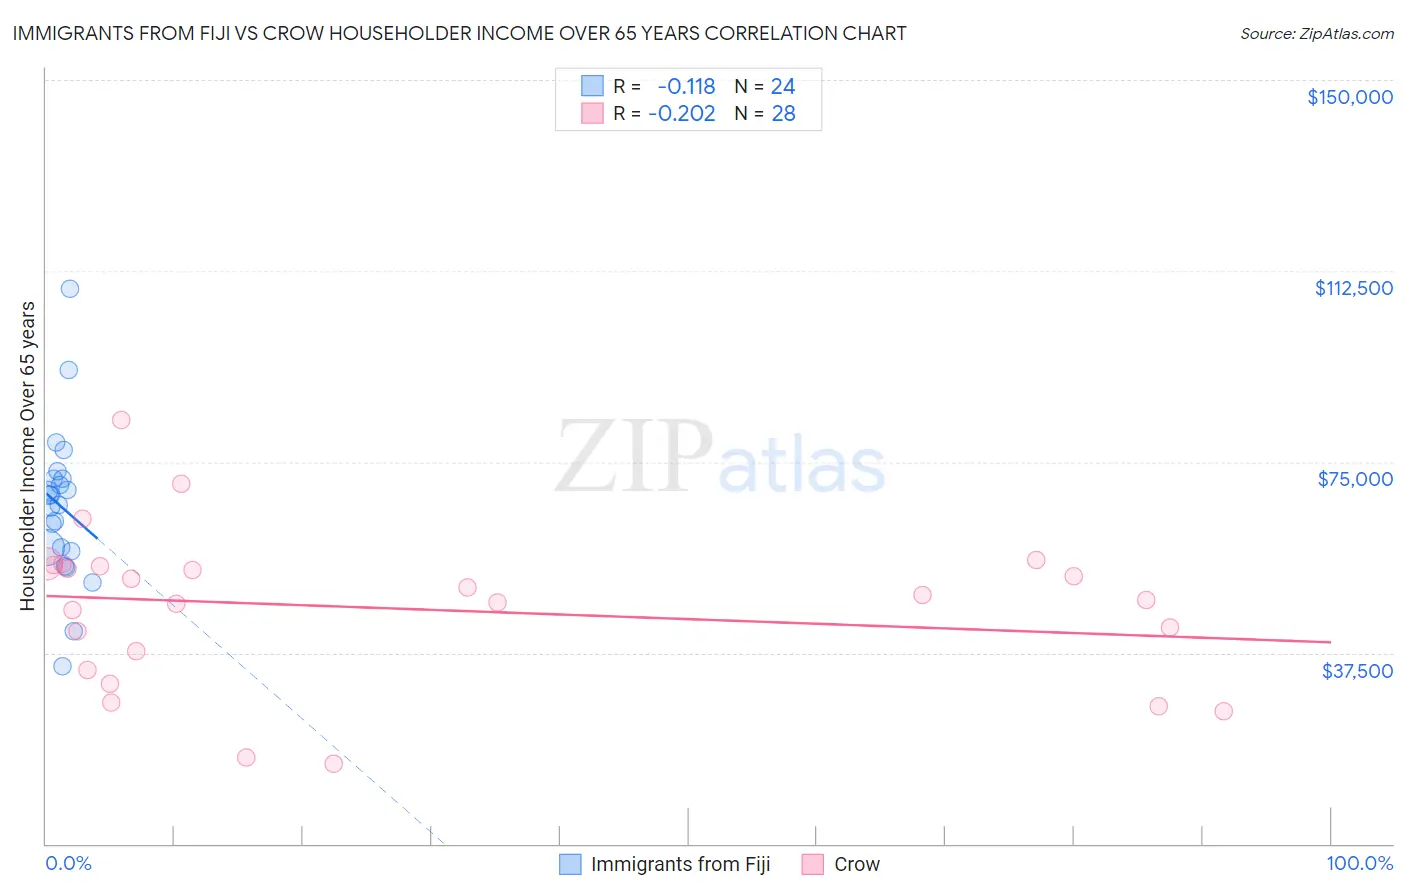
Immigrants from Fiji vs Crow Householder Income Over 65 years Correlation Chart
The statistical analysis conducted on geographies consisting of 93,711,523 people shows a poor negative correlation between the proportion of Immigrants from Fiji and household income with householder over the age of 65 in the United States with a correlation coefficient (R) of -0.118 and weighted average of $64,795. Similarly, the statistical analysis conducted on geographies consisting of 59,087,970 people shows a weak negative correlation between the proportion of Crow and household income with householder over the age of 65 in the United States with a correlation coefficient (R) of -0.202 and weighted average of $49,234, a difference of 31.6%.
Householder Income Over 65 years Correlation Summary
| Measurement | Immigrants from Fiji | Crow |
| Minimum | $34,792 | $15,714 |
| Maximum | $108,977 | $83,321 |
| Range | $74,185 | $67,607 |
| Mean | $66,250 | $46,192 |
| Median | $67,555 | $48,334 |
| Interquartile 25% (IQ1) | $57,741 | $35,989 |
| Interquartile 75% (IQ3) | $71,770 | $54,581 |
| Interquartile Range (IQR) | $14,029 | $18,592 |
| Standard Deviation (Sample) | $15,202 | $15,233 |
| Standard Deviation (Population) | $14,882 | $14,959 |
Similar Demographics by Householder Income Over 65 years
Demographics Similar to Immigrants from Fiji by Householder Income Over 65 years
In terms of householder income over 65 years, the demographic groups most similar to Immigrants from Fiji are Immigrants from Europe ($64,828, a difference of 0.050%), Immigrants from North America ($64,856, a difference of 0.090%), Hawaiian ($64,920, a difference of 0.19%), Immigrants from Western Europe ($64,933, a difference of 0.21%), and Northern European ($64,658, a difference of 0.21%).
| Demographics | Rating | Rank | Householder Income Over 65 years |
| Sierra Leoneans | 98.6 /100 | #75 | Exceptional $65,038 |
| Ethiopians | 98.5 /100 | #76 | Exceptional $64,989 |
| Immigrants | Canada | 98.5 /100 | #77 | Exceptional $64,952 |
| Immigrants | Western Europe | 98.5 /100 | #78 | Exceptional $64,933 |
| Hawaiians | 98.4 /100 | #79 | Exceptional $64,920 |
| Immigrants | North America | 98.3 /100 | #80 | Exceptional $64,856 |
| Immigrants | Europe | 98.3 /100 | #81 | Exceptional $64,828 |
| Immigrants | Fiji | 98.2 /100 | #82 | Exceptional $64,795 |
| Northern Europeans | 97.9 /100 | #83 | Exceptional $64,658 |
| Immigrants | Greece | 97.9 /100 | #84 | Exceptional $64,636 |
| Immigrants | Lebanon | 97.6 /100 | #85 | Exceptional $64,521 |
| Immigrants | Russia | 97.6 /100 | #86 | Exceptional $64,512 |
| Austrians | 97.5 /100 | #87 | Exceptional $64,470 |
| Immigrants | Romania | 97.5 /100 | #88 | Exceptional $64,462 |
| Paraguayans | 97.4 /100 | #89 | Exceptional $64,443 |
Demographics Similar to Crow by Householder Income Over 65 years
In terms of householder income over 65 years, the demographic groups most similar to Crow are Cuban ($49,152, a difference of 0.17%), Tohono O'odham ($49,121, a difference of 0.23%), Immigrants from Caribbean ($48,535, a difference of 1.4%), Immigrants from Dominica ($50,071, a difference of 1.7%), and Cape Verdean ($50,077, a difference of 1.7%).
| Demographics | Rating | Rank | Householder Income Over 65 years |
| Hopi | 0.0 /100 | #328 | Tragic $50,925 |
| Blacks/African Americans | 0.0 /100 | #329 | Tragic $50,779 |
| Immigrants | Grenada | 0.0 /100 | #330 | Tragic $50,747 |
| Pima | 0.0 /100 | #331 | Tragic $50,539 |
| Dutch West Indians | 0.0 /100 | #332 | Tragic $50,475 |
| Cape Verdeans | 0.0 /100 | #333 | Tragic $50,077 |
| Immigrants | Dominica | 0.0 /100 | #334 | Tragic $50,071 |
| Crow | 0.0 /100 | #335 | Tragic $49,234 |
| Cubans | 0.0 /100 | #336 | Tragic $49,152 |
| Tohono O'odham | 0.0 /100 | #337 | Tragic $49,121 |
| Immigrants | Caribbean | 0.0 /100 | #338 | Tragic $48,535 |
| Navajo | 0.0 /100 | #339 | Tragic $47,722 |
| Immigrants | Yemen | 0.0 /100 | #340 | Tragic $47,527 |
| Dominicans | 0.0 /100 | #341 | Tragic $46,964 |
| Immigrants | Cabo Verde | 0.0 /100 | #342 | Tragic $46,654 |