Assyrian/Chaldean/Syriac vs Crow Householder Income Over 65 years
COMPARE
Assyrian/Chaldean/Syriac
Crow
Householder Income Over 65 years
Householder Income Over 65 years Comparison
Assyrians/Chaldeans/Syriacs
Crow
$64,108
HOUSEHOLDER INCOME OVER 65 YEARS
96.4/ 100
METRIC RATING
99th/ 347
METRIC RANK
$49,234
HOUSEHOLDER INCOME OVER 65 YEARS
0.0/ 100
METRIC RATING
335th/ 347
METRIC RANK
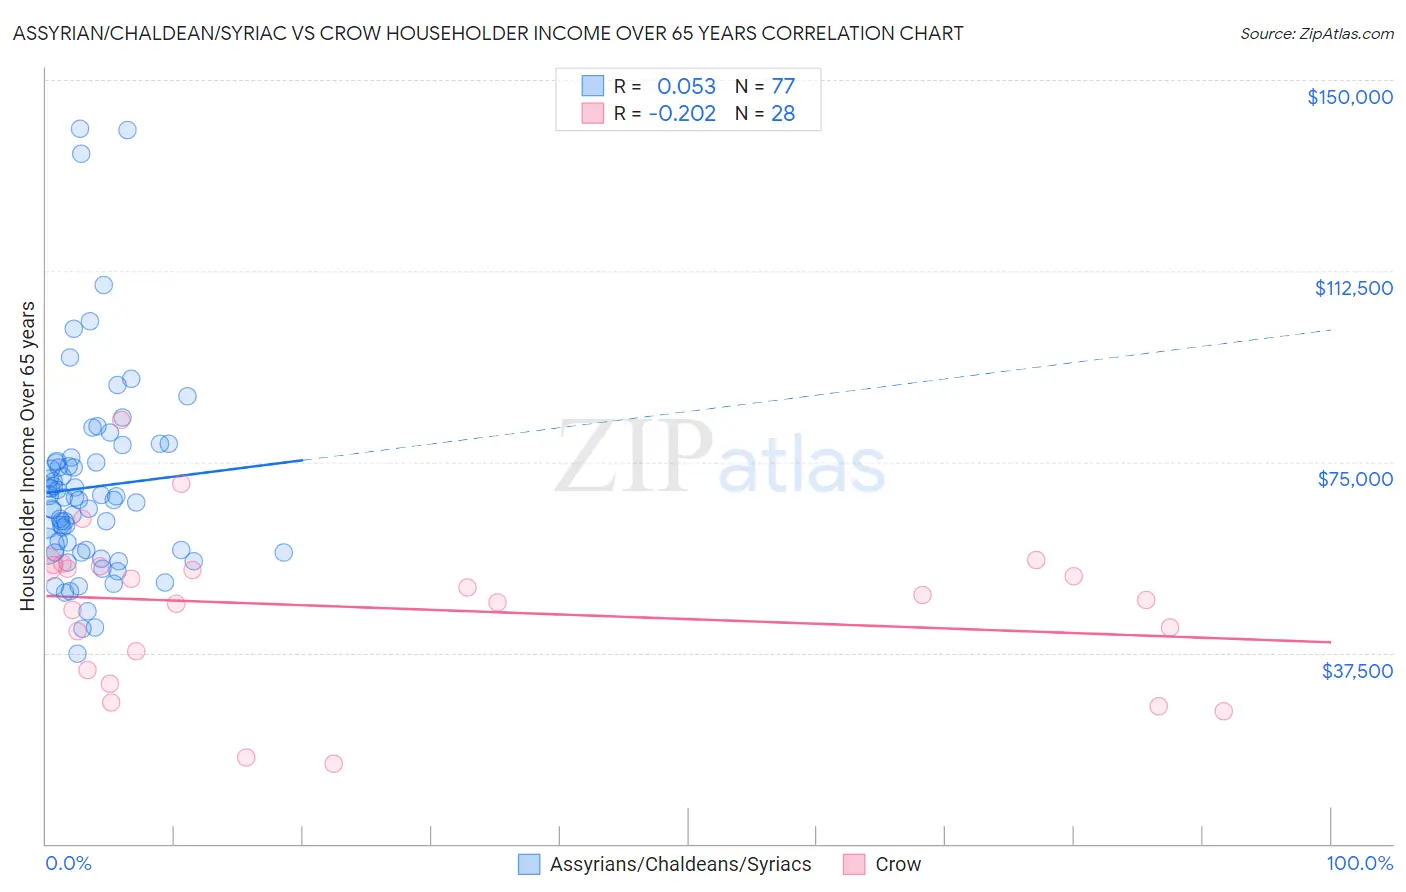
Assyrian/Chaldean/Syriac vs Crow Householder Income Over 65 years Correlation Chart
The statistical analysis conducted on geographies consisting of 110,223,664 people shows a slight positive correlation between the proportion of Assyrians/Chaldeans/Syriacs and household income with householder over the age of 65 in the United States with a correlation coefficient (R) of 0.053 and weighted average of $64,108. Similarly, the statistical analysis conducted on geographies consisting of 59,087,970 people shows a weak negative correlation between the proportion of Crow and household income with householder over the age of 65 in the United States with a correlation coefficient (R) of -0.202 and weighted average of $49,234, a difference of 30.2%.
Householder Income Over 65 years Correlation Summary
| Measurement | Assyrian/Chaldean/Syriac | Crow |
| Minimum | $37,310 | $15,714 |
| Maximum | $140,431 | $83,321 |
| Range | $103,121 | $67,607 |
| Mean | $70,014 | $46,192 |
| Median | $67,459 | $48,334 |
| Interquartile 25% (IQ1) | $57,422 | $35,989 |
| Interquartile 75% (IQ3) | $75,038 | $54,581 |
| Interquartile Range (IQR) | $17,616 | $18,592 |
| Standard Deviation (Sample) | $19,596 | $15,233 |
| Standard Deviation (Population) | $19,468 | $14,959 |
Similar Demographics by Householder Income Over 65 years
Demographics Similar to Assyrians/Chaldeans/Syriacs by Householder Income Over 65 years
In terms of householder income over 65 years, the demographic groups most similar to Assyrians/Chaldeans/Syriacs are Immigrants from South Eastern Asia ($64,089, a difference of 0.030%), Romanian ($64,142, a difference of 0.050%), Immigrants from Italy ($64,065, a difference of 0.070%), Sri Lankan ($64,201, a difference of 0.14%), and Chilean ($63,957, a difference of 0.24%).
| Demographics | Rating | Rank | Householder Income Over 65 years |
| Immigrants | Bulgaria | 97.3 /100 | #92 | Exceptional $64,379 |
| Jordanians | 97.1 /100 | #93 | Exceptional $64,313 |
| Immigrants | Egypt | 97.0 /100 | #94 | Exceptional $64,299 |
| Immigrants | Latvia | 97.0 /100 | #95 | Exceptional $64,298 |
| Immigrants | Hungary | 97.0 /100 | #96 | Exceptional $64,277 |
| Sri Lankans | 96.7 /100 | #97 | Exceptional $64,201 |
| Romanians | 96.5 /100 | #98 | Exceptional $64,142 |
| Assyrians/Chaldeans/Syriacs | 96.4 /100 | #99 | Exceptional $64,108 |
| Immigrants | South Eastern Asia | 96.3 /100 | #100 | Exceptional $64,089 |
| Immigrants | Italy | 96.2 /100 | #101 | Exceptional $64,065 |
| Chileans | 95.8 /100 | #102 | Exceptional $63,957 |
| British | 95.7 /100 | #103 | Exceptional $63,940 |
| Immigrants | Cameroon | 95.6 /100 | #104 | Exceptional $63,907 |
| Italians | 95.5 /100 | #105 | Exceptional $63,885 |
| Immigrants | Argentina | 95.5 /100 | #106 | Exceptional $63,885 |
Demographics Similar to Crow by Householder Income Over 65 years
In terms of householder income over 65 years, the demographic groups most similar to Crow are Cuban ($49,152, a difference of 0.17%), Tohono O'odham ($49,121, a difference of 0.23%), Immigrants from Caribbean ($48,535, a difference of 1.4%), Immigrants from Dominica ($50,071, a difference of 1.7%), and Cape Verdean ($50,077, a difference of 1.7%).
| Demographics | Rating | Rank | Householder Income Over 65 years |
| Hopi | 0.0 /100 | #328 | Tragic $50,925 |
| Blacks/African Americans | 0.0 /100 | #329 | Tragic $50,779 |
| Immigrants | Grenada | 0.0 /100 | #330 | Tragic $50,747 |
| Pima | 0.0 /100 | #331 | Tragic $50,539 |
| Dutch West Indians | 0.0 /100 | #332 | Tragic $50,475 |
| Cape Verdeans | 0.0 /100 | #333 | Tragic $50,077 |
| Immigrants | Dominica | 0.0 /100 | #334 | Tragic $50,071 |
| Crow | 0.0 /100 | #335 | Tragic $49,234 |
| Cubans | 0.0 /100 | #336 | Tragic $49,152 |
| Tohono O'odham | 0.0 /100 | #337 | Tragic $49,121 |
| Immigrants | Caribbean | 0.0 /100 | #338 | Tragic $48,535 |
| Navajo | 0.0 /100 | #339 | Tragic $47,722 |
| Immigrants | Yemen | 0.0 /100 | #340 | Tragic $47,527 |
| Dominicans | 0.0 /100 | #341 | Tragic $46,964 |
| Immigrants | Cabo Verde | 0.0 /100 | #342 | Tragic $46,654 |