White/Caucasian vs Iraqi Householder Income Over 65 years
COMPARE
White/Caucasian
Iraqi
Householder Income Over 65 years
Householder Income Over 65 years Comparison
Whites/Caucasians
Iraqis
$58,847
HOUSEHOLDER INCOME OVER 65 YEARS
9.8/ 100
METRIC RATING
213th/ 347
METRIC RANK
$60,466
HOUSEHOLDER INCOME OVER 65 YEARS
37.2/ 100
METRIC RATING
184th/ 347
METRIC RANK
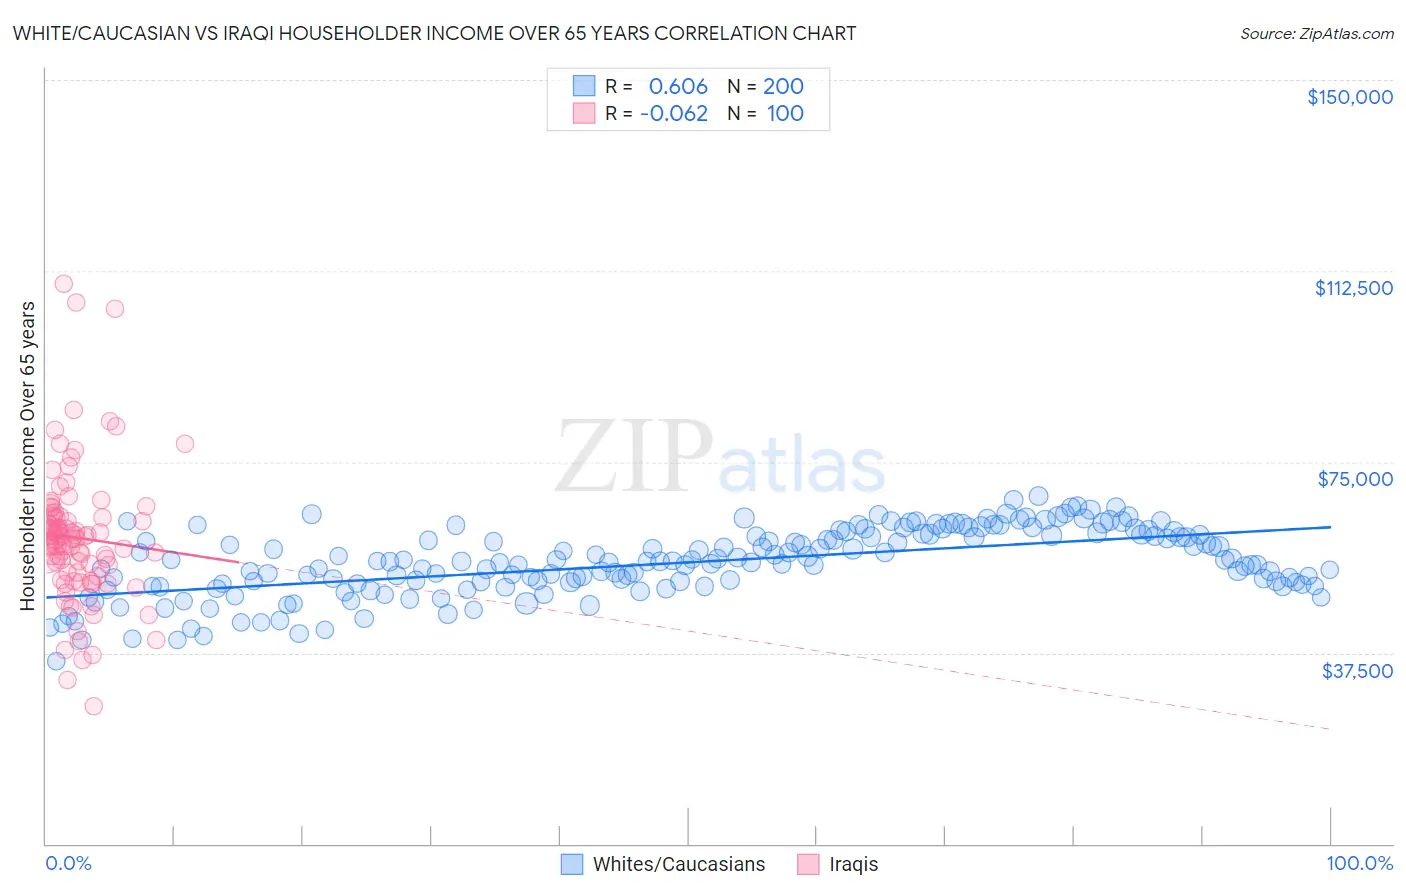
White/Caucasian vs Iraqi Householder Income Over 65 years Correlation Chart
The statistical analysis conducted on geographies consisting of 577,509,844 people shows a significant positive correlation between the proportion of Whites/Caucasians and household income with householder over the age of 65 in the United States with a correlation coefficient (R) of 0.606 and weighted average of $58,847. Similarly, the statistical analysis conducted on geographies consisting of 170,476,894 people shows a slight negative correlation between the proportion of Iraqis and household income with householder over the age of 65 in the United States with a correlation coefficient (R) of -0.062 and weighted average of $60,466, a difference of 2.8%.
Householder Income Over 65 years Correlation Summary
| Measurement | White/Caucasian | Iraqi |
| Minimum | $35,837 | $27,083 |
| Maximum | $68,217 | $110,088 |
| Range | $32,380 | $83,005 |
| Mean | $55,258 | $60,115 |
| Median | $55,418 | $59,854 |
| Interquartile 25% (IQ1) | $51,091 | $52,888 |
| Interquartile 75% (IQ3) | $60,670 | $64,237 |
| Interquartile Range (IQR) | $9,580 | $11,349 |
| Standard Deviation (Sample) | $6,600 | $13,499 |
| Standard Deviation (Population) | $6,583 | $13,432 |
Similar Demographics by Householder Income Over 65 years
Demographics Similar to Whites/Caucasians by Householder Income Over 65 years
In terms of householder income over 65 years, the demographic groups most similar to Whites/Caucasians are Colombian ($58,851, a difference of 0.010%), Nepalese ($58,761, a difference of 0.15%), Immigrants from Nigeria ($58,942, a difference of 0.16%), Nigerian ($58,992, a difference of 0.25%), and Slovak ($59,039, a difference of 0.33%).
| Demographics | Rating | Rank | Householder Income Over 65 years |
| Immigrants | South America | 13.0 /100 | #206 | Poor $59,151 |
| Salvadorans | 12.9 /100 | #207 | Poor $59,141 |
| Uruguayans | 12.3 /100 | #208 | Poor $59,090 |
| Slovaks | 11.7 /100 | #209 | Poor $59,039 |
| Nigerians | 11.2 /100 | #210 | Poor $58,992 |
| Immigrants | Nigeria | 10.7 /100 | #211 | Poor $58,942 |
| Colombians | 9.8 /100 | #212 | Tragic $58,851 |
| Whites/Caucasians | 9.8 /100 | #213 | Tragic $58,847 |
| Nepalese | 9.0 /100 | #214 | Tragic $58,761 |
| Immigrants | Ghana | 7.9 /100 | #215 | Tragic $58,624 |
| Immigrants | Middle Africa | 6.2 /100 | #216 | Tragic $58,375 |
| Sudanese | 5.7 /100 | #217 | Tragic $58,281 |
| Panamanians | 5.6 /100 | #218 | Tragic $58,266 |
| Malaysians | 5.5 /100 | #219 | Tragic $58,244 |
| Yugoslavians | 5.5 /100 | #220 | Tragic $58,243 |
Demographics Similar to Iraqis by Householder Income Over 65 years
In terms of householder income over 65 years, the demographic groups most similar to Iraqis are Kenyan ($60,514, a difference of 0.080%), Czechoslovakian ($60,581, a difference of 0.19%), Celtic ($60,608, a difference of 0.23%), Immigrants from Morocco ($60,647, a difference of 0.30%), and Welsh ($60,666, a difference of 0.33%).
| Demographics | Rating | Rank | Householder Income Over 65 years |
| Alaska Natives | 44.3 /100 | #177 | Average $60,748 |
| Yup'ik | 43.7 /100 | #178 | Average $60,727 |
| Welsh | 42.2 /100 | #179 | Average $60,666 |
| Immigrants | Morocco | 41.7 /100 | #180 | Average $60,647 |
| Celtics | 40.7 /100 | #181 | Average $60,608 |
| Czechoslovakians | 40.0 /100 | #182 | Average $60,581 |
| Kenyans | 38.4 /100 | #183 | Fair $60,514 |
| Iraqis | 37.2 /100 | #184 | Fair $60,466 |
| Albanians | 32.0 /100 | #185 | Fair $60,249 |
| Slovenes | 31.8 /100 | #186 | Fair $60,241 |
| Immigrants | Thailand | 31.3 /100 | #187 | Fair $60,217 |
| Immigrants | Eritrea | 28.6 /100 | #188 | Fair $60,096 |
| Ghanaians | 27.5 /100 | #189 | Fair $60,043 |
| Puget Sound Salish | 25.3 /100 | #190 | Fair $59,934 |
| Belgians | 24.9 /100 | #191 | Fair $59,915 |