Immigrants from Saudi Arabia vs Crow Householder Income Over 65 years
COMPARE
Immigrants from Saudi Arabia
Crow
Householder Income Over 65 years
Householder Income Over 65 years Comparison
Immigrants from Saudi Arabia
Crow
$63,355
HOUSEHOLDER INCOME OVER 65 YEARS
92.4/ 100
METRIC RATING
114th/ 347
METRIC RANK
$49,234
HOUSEHOLDER INCOME OVER 65 YEARS
0.0/ 100
METRIC RATING
335th/ 347
METRIC RANK
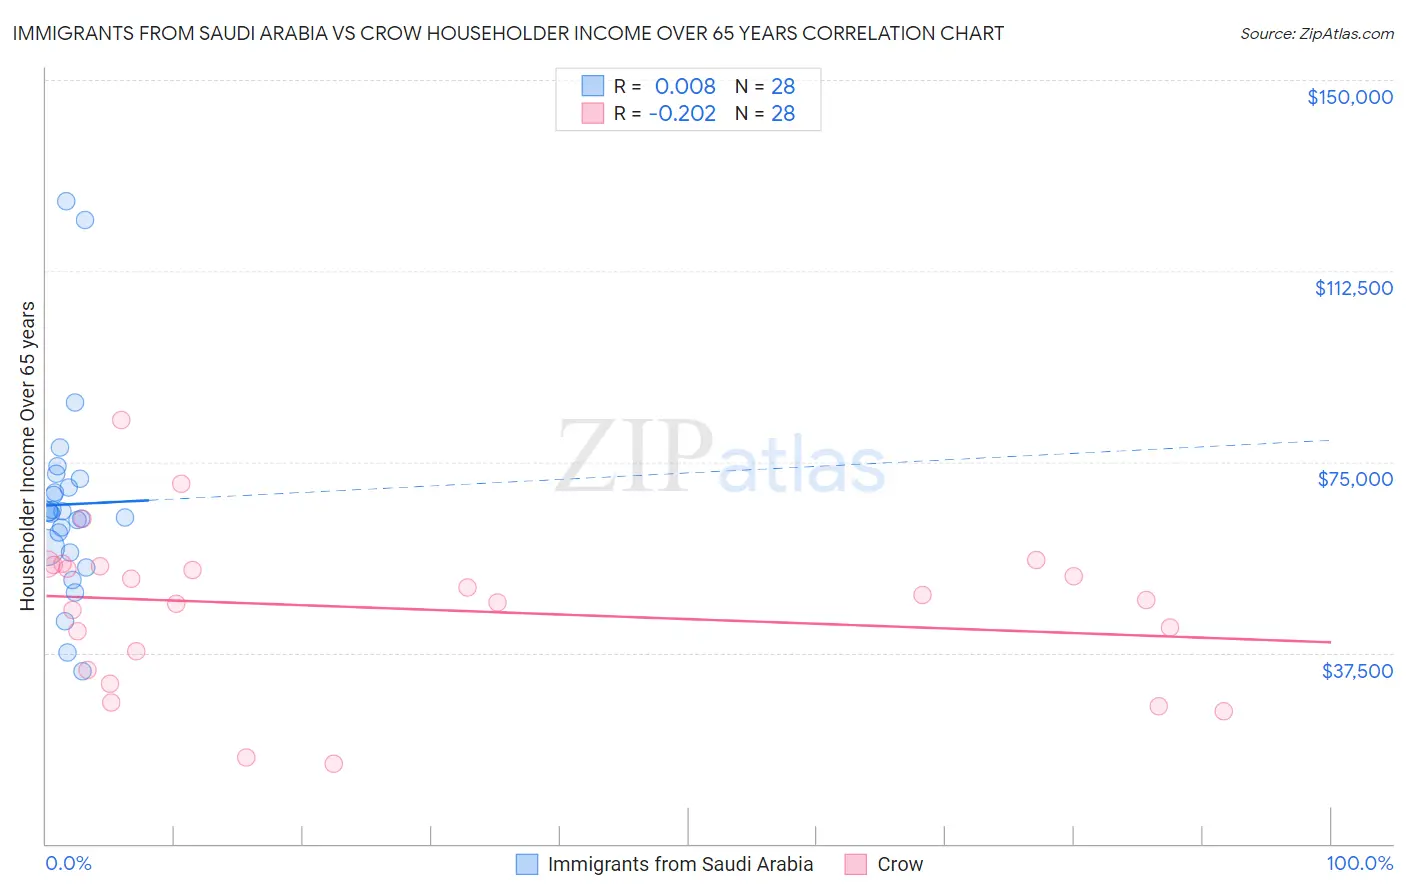
Immigrants from Saudi Arabia vs Crow Householder Income Over 65 years Correlation Chart
The statistical analysis conducted on geographies consisting of 164,084,290 people shows no correlation between the proportion of Immigrants from Saudi Arabia and household income with householder over the age of 65 in the United States with a correlation coefficient (R) of 0.008 and weighted average of $63,355. Similarly, the statistical analysis conducted on geographies consisting of 59,087,970 people shows a weak negative correlation between the proportion of Crow and household income with householder over the age of 65 in the United States with a correlation coefficient (R) of -0.202 and weighted average of $49,234, a difference of 28.7%.
Householder Income Over 65 years Correlation Summary
| Measurement | Immigrants from Saudi Arabia | Crow |
| Minimum | $33,914 | $15,714 |
| Maximum | $126,236 | $83,321 |
| Range | $92,322 | $67,607 |
| Mean | $66,648 | $46,192 |
| Median | $65,018 | $48,334 |
| Interquartile 25% (IQ1) | $57,633 | $35,989 |
| Interquartile 75% (IQ3) | $70,874 | $54,581 |
| Interquartile Range (IQR) | $13,241 | $18,592 |
| Standard Deviation (Sample) | $19,913 | $15,233 |
| Standard Deviation (Population) | $19,554 | $14,959 |
Similar Demographics by Householder Income Over 65 years
Demographics Similar to Immigrants from Saudi Arabia by Householder Income Over 65 years
In terms of householder income over 65 years, the demographic groups most similar to Immigrants from Saudi Arabia are Immigrants from Serbia ($63,387, a difference of 0.050%), Croatian ($63,225, a difference of 0.20%), Syrian ($63,494, a difference of 0.22%), Guamanian/Chamorro ($63,187, a difference of 0.26%), and Immigrants from Spain ($63,540, a difference of 0.29%).
| Demographics | Rating | Rank | Householder Income Over 65 years |
| Pakistanis | 95.3 /100 | #107 | Exceptional $63,844 |
| Palestinians | 95.1 /100 | #108 | Exceptional $63,800 |
| Europeans | 95.0 /100 | #109 | Exceptional $63,779 |
| Immigrants | Zimbabwe | 94.3 /100 | #110 | Exceptional $63,643 |
| Immigrants | Spain | 93.7 /100 | #111 | Exceptional $63,540 |
| Syrians | 93.4 /100 | #112 | Exceptional $63,494 |
| Immigrants | Serbia | 92.7 /100 | #113 | Exceptional $63,387 |
| Immigrants | Saudi Arabia | 92.4 /100 | #114 | Exceptional $63,355 |
| Croatians | 91.4 /100 | #115 | Exceptional $63,225 |
| Guamanians/Chamorros | 91.1 /100 | #116 | Exceptional $63,187 |
| Immigrants | Croatia | 90.9 /100 | #117 | Exceptional $63,168 |
| Danes | 90.5 /100 | #118 | Exceptional $63,117 |
| Immigrants | Jordan | 89.8 /100 | #119 | Excellent $63,041 |
| Ukrainians | 89.7 /100 | #120 | Excellent $63,032 |
| Immigrants | Vietnam | 89.5 /100 | #121 | Excellent $63,014 |
Demographics Similar to Crow by Householder Income Over 65 years
In terms of householder income over 65 years, the demographic groups most similar to Crow are Cuban ($49,152, a difference of 0.17%), Tohono O'odham ($49,121, a difference of 0.23%), Immigrants from Caribbean ($48,535, a difference of 1.4%), Immigrants from Dominica ($50,071, a difference of 1.7%), and Cape Verdean ($50,077, a difference of 1.7%).
| Demographics | Rating | Rank | Householder Income Over 65 years |
| Hopi | 0.0 /100 | #328 | Tragic $50,925 |
| Blacks/African Americans | 0.0 /100 | #329 | Tragic $50,779 |
| Immigrants | Grenada | 0.0 /100 | #330 | Tragic $50,747 |
| Pima | 0.0 /100 | #331 | Tragic $50,539 |
| Dutch West Indians | 0.0 /100 | #332 | Tragic $50,475 |
| Cape Verdeans | 0.0 /100 | #333 | Tragic $50,077 |
| Immigrants | Dominica | 0.0 /100 | #334 | Tragic $50,071 |
| Crow | 0.0 /100 | #335 | Tragic $49,234 |
| Cubans | 0.0 /100 | #336 | Tragic $49,152 |
| Tohono O'odham | 0.0 /100 | #337 | Tragic $49,121 |
| Immigrants | Caribbean | 0.0 /100 | #338 | Tragic $48,535 |
| Navajo | 0.0 /100 | #339 | Tragic $47,722 |
| Immigrants | Yemen | 0.0 /100 | #340 | Tragic $47,527 |
| Dominicans | 0.0 /100 | #341 | Tragic $46,964 |
| Immigrants | Cabo Verde | 0.0 /100 | #342 | Tragic $46,654 |