Cuban vs Crow Householder Income Over 65 years
COMPARE
Cuban
Crow
Householder Income Over 65 years
Householder Income Over 65 years Comparison
Cubans
Crow
$49,152
HOUSEHOLDER INCOME OVER 65 YEARS
0.0/ 100
METRIC RATING
336th/ 347
METRIC RANK
$49,234
HOUSEHOLDER INCOME OVER 65 YEARS
0.0/ 100
METRIC RATING
335th/ 347
METRIC RANK
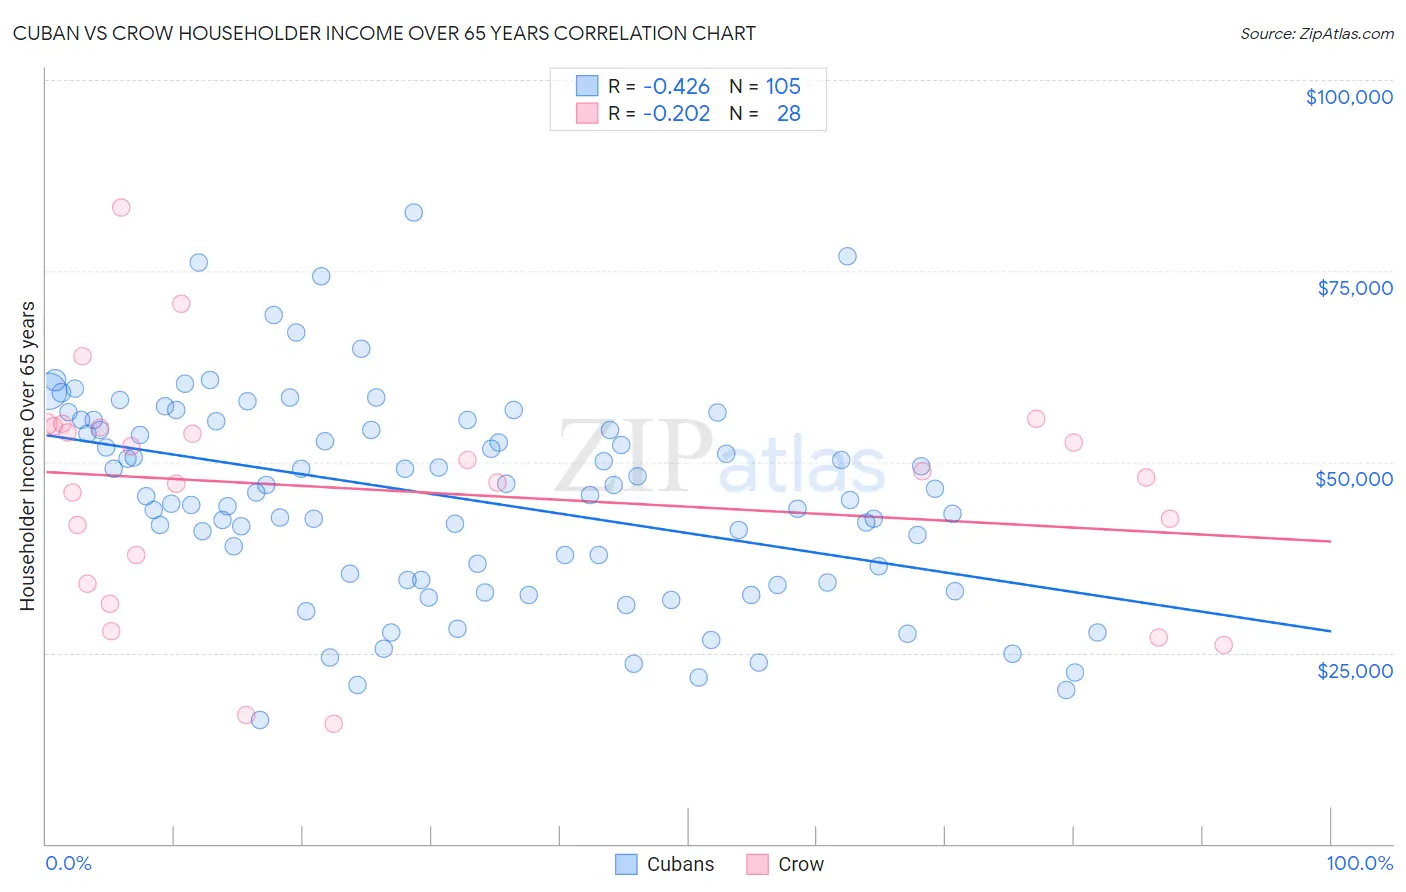
Cuban vs Crow Householder Income Over 65 years Correlation Chart
The statistical analysis conducted on geographies consisting of 447,397,071 people shows a moderate negative correlation between the proportion of Cubans and household income with householder over the age of 65 in the United States with a correlation coefficient (R) of -0.426 and weighted average of $49,152. Similarly, the statistical analysis conducted on geographies consisting of 59,087,970 people shows a weak negative correlation between the proportion of Crow and household income with householder over the age of 65 in the United States with a correlation coefficient (R) of -0.202 and weighted average of $49,234, a difference of 0.17%.
Householder Income Over 65 years Correlation Summary
| Measurement | Cuban | Crow |
| Minimum | $16,239 | $15,714 |
| Maximum | $82,682 | $83,321 |
| Range | $66,443 | $67,607 |
| Mean | $45,309 | $46,192 |
| Median | $45,658 | $48,334 |
| Interquartile 25% (IQ1) | $34,482 | $35,989 |
| Interquartile 75% (IQ3) | $54,771 | $54,581 |
| Interquartile Range (IQR) | $20,289 | $18,592 |
| Standard Deviation (Sample) | $13,460 | $15,233 |
| Standard Deviation (Population) | $13,396 | $14,959 |
Demographics Similar to Cubans and Crow by Householder Income Over 65 years
In terms of householder income over 65 years, the demographic groups most similar to Cubans are Tohono O'odham ($49,121, a difference of 0.060%), Immigrants from Caribbean ($48,535, a difference of 1.3%), Immigrants from Dominica ($50,071, a difference of 1.9%), Cape Verdean ($50,077, a difference of 1.9%), and Dutch West Indian ($50,475, a difference of 2.7%). Similarly, the demographic groups most similar to Crow are Tohono O'odham ($49,121, a difference of 0.23%), Immigrants from Caribbean ($48,535, a difference of 1.4%), Immigrants from Dominica ($50,071, a difference of 1.7%), Cape Verdean ($50,077, a difference of 1.7%), and Dutch West Indian ($50,475, a difference of 2.5%).
| Demographics | Rating | Rank | Householder Income Over 65 years |
| Immigrants | Haiti | 0.0 /100 | #325 | Tragic $51,219 |
| Kiowa | 0.0 /100 | #326 | Tragic $51,140 |
| Bahamians | 0.0 /100 | #327 | Tragic $51,000 |
| Hopi | 0.0 /100 | #328 | Tragic $50,925 |
| Blacks/African Americans | 0.0 /100 | #329 | Tragic $50,779 |
| Immigrants | Grenada | 0.0 /100 | #330 | Tragic $50,747 |
| Pima | 0.0 /100 | #331 | Tragic $50,539 |
| Dutch West Indians | 0.0 /100 | #332 | Tragic $50,475 |
| Cape Verdeans | 0.0 /100 | #333 | Tragic $50,077 |
| Immigrants | Dominica | 0.0 /100 | #334 | Tragic $50,071 |
| Crow | 0.0 /100 | #335 | Tragic $49,234 |
| Cubans | 0.0 /100 | #336 | Tragic $49,152 |
| Tohono O'odham | 0.0 /100 | #337 | Tragic $49,121 |
| Immigrants | Caribbean | 0.0 /100 | #338 | Tragic $48,535 |
| Navajo | 0.0 /100 | #339 | Tragic $47,722 |
| Immigrants | Yemen | 0.0 /100 | #340 | Tragic $47,527 |
| Dominicans | 0.0 /100 | #341 | Tragic $46,964 |
| Immigrants | Cabo Verde | 0.0 /100 | #342 | Tragic $46,654 |
| Immigrants | Dominican Republic | 0.0 /100 | #343 | Tragic $45,758 |
| Houma | 0.0 /100 | #344 | Tragic $44,822 |
| Immigrants | Cuba | 0.0 /100 | #345 | Tragic $44,735 |