White/Caucasian vs Samoan Householder Income Over 65 years
COMPARE
White/Caucasian
Samoan
Householder Income Over 65 years
Householder Income Over 65 years Comparison
Whites/Caucasians
Samoans
$58,847
HOUSEHOLDER INCOME OVER 65 YEARS
9.8/ 100
METRIC RATING
213th/ 347
METRIC RANK
$65,427
HOUSEHOLDER INCOME OVER 65 YEARS
99.1/ 100
METRIC RATING
69th/ 347
METRIC RANK
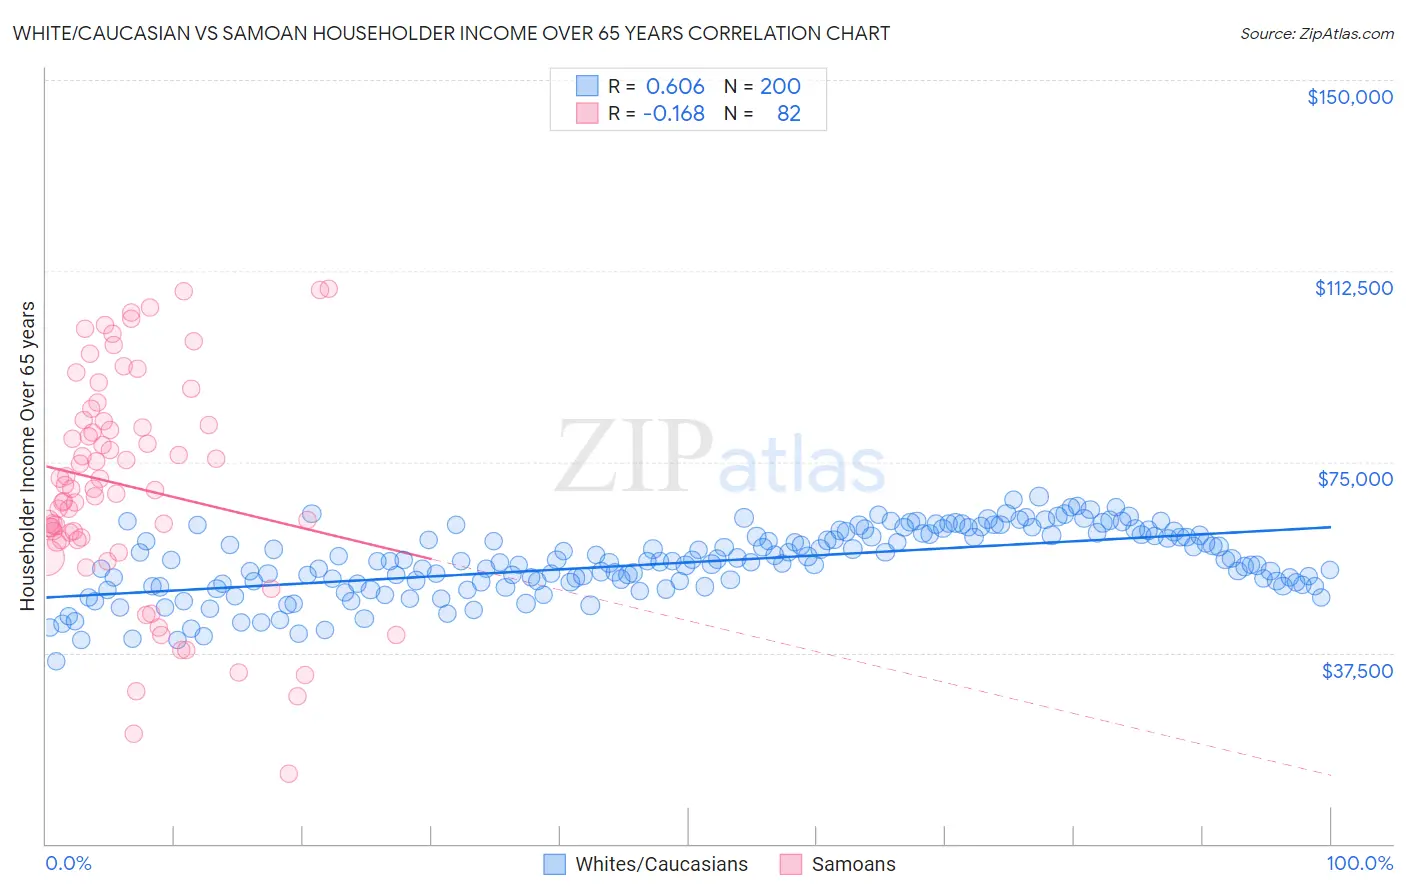
White/Caucasian vs Samoan Householder Income Over 65 years Correlation Chart
The statistical analysis conducted on geographies consisting of 577,509,844 people shows a significant positive correlation between the proportion of Whites/Caucasians and household income with householder over the age of 65 in the United States with a correlation coefficient (R) of 0.606 and weighted average of $58,847. Similarly, the statistical analysis conducted on geographies consisting of 224,404,839 people shows a poor negative correlation between the proportion of Samoans and household income with householder over the age of 65 in the United States with a correlation coefficient (R) of -0.168 and weighted average of $65,427, a difference of 11.2%.
Householder Income Over 65 years Correlation Summary
| Measurement | White/Caucasian | Samoan |
| Minimum | $35,837 | $13,651 |
| Maximum | $68,217 | $108,977 |
| Range | $32,380 | $95,326 |
| Mean | $55,258 | $70,206 |
| Median | $55,418 | $69,618 |
| Interquartile 25% (IQ1) | $51,091 | $59,611 |
| Interquartile 75% (IQ3) | $60,670 | $83,086 |
| Interquartile Range (IQR) | $9,580 | $23,475 |
| Standard Deviation (Sample) | $6,600 | $21,405 |
| Standard Deviation (Population) | $6,583 | $21,274 |
Similar Demographics by Householder Income Over 65 years
Demographics Similar to Whites/Caucasians by Householder Income Over 65 years
In terms of householder income over 65 years, the demographic groups most similar to Whites/Caucasians are Colombian ($58,851, a difference of 0.010%), Nepalese ($58,761, a difference of 0.15%), Immigrants from Nigeria ($58,942, a difference of 0.16%), Nigerian ($58,992, a difference of 0.25%), and Slovak ($59,039, a difference of 0.33%).
| Demographics | Rating | Rank | Householder Income Over 65 years |
| Immigrants | South America | 13.0 /100 | #206 | Poor $59,151 |
| Salvadorans | 12.9 /100 | #207 | Poor $59,141 |
| Uruguayans | 12.3 /100 | #208 | Poor $59,090 |
| Slovaks | 11.7 /100 | #209 | Poor $59,039 |
| Nigerians | 11.2 /100 | #210 | Poor $58,992 |
| Immigrants | Nigeria | 10.7 /100 | #211 | Poor $58,942 |
| Colombians | 9.8 /100 | #212 | Tragic $58,851 |
| Whites/Caucasians | 9.8 /100 | #213 | Tragic $58,847 |
| Nepalese | 9.0 /100 | #214 | Tragic $58,761 |
| Immigrants | Ghana | 7.9 /100 | #215 | Tragic $58,624 |
| Immigrants | Middle Africa | 6.2 /100 | #216 | Tragic $58,375 |
| Sudanese | 5.7 /100 | #217 | Tragic $58,281 |
| Panamanians | 5.6 /100 | #218 | Tragic $58,266 |
| Malaysians | 5.5 /100 | #219 | Tragic $58,244 |
| Yugoslavians | 5.5 /100 | #220 | Tragic $58,243 |
Demographics Similar to Samoans by Householder Income Over 65 years
In terms of householder income over 65 years, the demographic groups most similar to Samoans are Egyptian ($65,441, a difference of 0.020%), Immigrants from Malaysia ($65,497, a difference of 0.11%), Mongolian ($65,326, a difference of 0.15%), Greek ($65,306, a difference of 0.19%), and Argentinean ($65,246, a difference of 0.28%).
| Demographics | Rating | Rank | Householder Income Over 65 years |
| Immigrants | Sierra Leone | 99.5 /100 | #62 | Exceptional $66,009 |
| Marshallese | 99.4 /100 | #63 | Exceptional $65,874 |
| Zimbabweans | 99.4 /100 | #64 | Exceptional $65,854 |
| Immigrants | England | 99.3 /100 | #65 | Exceptional $65,715 |
| South Africans | 99.3 /100 | #66 | Exceptional $65,652 |
| Immigrants | Malaysia | 99.1 /100 | #67 | Exceptional $65,497 |
| Egyptians | 99.1 /100 | #68 | Exceptional $65,441 |
| Samoans | 99.1 /100 | #69 | Exceptional $65,427 |
| Mongolians | 99.0 /100 | #70 | Exceptional $65,326 |
| Greeks | 98.9 /100 | #71 | Exceptional $65,306 |
| Argentineans | 98.9 /100 | #72 | Exceptional $65,246 |
| Immigrants | Ethiopia | 98.9 /100 | #73 | Exceptional $65,238 |
| Lithuanians | 98.8 /100 | #74 | Exceptional $65,209 |
| Sierra Leoneans | 98.6 /100 | #75 | Exceptional $65,038 |
| Ethiopians | 98.5 /100 | #76 | Exceptional $64,989 |