White/Caucasian vs British Householder Income Over 65 years

COMPARE

White/Caucasian
Race
Ancestry
AfghanAfricanAlaska NativeAlaskan AthabascanAlbanianAleutAlsatianAmericanApacheArabArapahoArgentineanArmenianAssyrian/Chaldean/SyriacAustralianAustrianBahamianBangladeshiBarbadianBasqueBelgianBelizeanBermudanBhutaneseBlackfeetBolivianBrazilianBritish West IndianBulgarianBurmeseCajunCambodianCanadianCape VerdeanCarpatho RusynCelticCentral AmericanCentral American IndianCherokeeCheyenneChickasawChileanChineseChippewaChoctawColombianColvilleComancheCosta RicanCreeCreekCroatianCrowCubanCypriotCzechCzechoslovakianDanishDelawareDominicanDutchDutch West IndianEastern EuropeanEcuadorianEgyptianEnglishEstonianEthiopianEuropeanFijianFilipinoFinnishFrenchFrench American IndianFrench CanadianGermanGerman RussianGhanaianGreekGuamanian/ChamorroGuatemalanGuyaneseHaitianHmongHonduranHopiHoumaHungarianIcelanderIndian (Asian)IndonesianInupiatIranianIraqiIrishIroquoisIsraeliItalianJamaicanJapaneseJordanianKenyanKiowaKoreanLaotianLatvianLebaneseLiberianLithuanianLumbeeLuxembourgerMacedonianMalaysianMalteseMarshalleseMenomineeMexicanMexican American IndianMongolianMoroccanNative HawaiianNavajoNepaleseNew ZealanderNicaraguanNigerianNorthern EuropeanNorwegianOkinawanOsageOttawaPaiutePakistaniPalestinianPanamanianParaguayanPennsylvania GermanPeruvianPimaPolishPortuguesePotawatomiPuebloPuerto RicanPuget Sound SalishRomanianRussianSalvadoranSamoanScandinavianScotch-IrishScottishSeminoleSenegaleseSerbianShoshoneSierra LeoneanSiouxSlavicSlovakSloveneSomaliSouth AfricanSouth AmericanSouth American IndianSoviet UnionSpaniardSpanishSpanish AmericanSpanish American IndianSri LankanSubsaharan AfricanSudaneseSwedishSwissSyrianTaiwaneseThaiTlingit-HaidaTohono O'OdhamTonganTrinidadian and TobagonianTsimshianTurkishU.S. Virgin IslanderUgandanUkrainianUruguayanUteVenezuelanVietnameseWelshWest IndianYakamaYaquiYugoslavianYumanYup'ikZimbabwean
Immigration
NonimmigrantsImmigrantsAfghanistanAfricaAlbaniaArgentinaArmeniaAsiaAustraliaAustriaBahamasBangladeshBarbadosBelarusBelgiumBelizeBoliviaBosnia and HerzegovinaBrazilBulgariaBurma/MyanmarCabo VerdeCambodiaCameroonCanadaCaribbeanCentral AmericaChileChinaColombiaCongoCosta RicaCroatiaCubaCzechoslovakiaDenmarkDominicaDominican RepublicEastern AfricaEastern AsiaEastern EuropeEcuadorEgyptEl SalvadorEnglandEritreaEthiopiaEuropeFijiFranceGermanyGhanaGreeceGrenadaGuatemalaGuyanaHaitiHondurasHong KongHungaryIndiaIndonesiaIranIraqIrelandIsraelItalyJamaicaJapanJordanKazakhstanKenyaKoreaKuwaitLaosLatin AmericaLatviaLebanonLiberiaLithuaniaMalaysiaMexicoMicronesiaMiddle AfricaMoldovaMoroccoNepalNetherlandsNicaraguaNigeriaNorth AmericaNorth MacedoniaNorthern AfricaNorthern EuropeNorwayOceaniaPakistanPanamaPeruPhilippinesPolandPortugalRomaniaRussiaSaudi ArabiaScotlandSenegalSerbiaSierra LeoneSingaporeSomaliaSouth AfricaSouth AmericaSouth Central AsiaSouth Eastern AsiaSouthern EuropeSpainSri LankaSt. Vincent and the GrenadinesSudanSwedenSwitzerlandSyriaTaiwanThailandTrinidad and TobagoTurkeyUgandaUkraineUruguayUzbekistanVenezuelaVietnamWest IndiesWestern AfricaWestern AsiaWestern EuropeYemenZaireZimbabweAzores
British
Race
Ancestry
AfghanAfricanAlaska NativeAlaskan AthabascanAlbanianAleutAlsatianAmericanApacheArabArapahoArgentineanArmenianAssyrian/Chaldean/SyriacAustralianAustrianBahamianBangladeshiBarbadianBasqueBelgianBelizeanBermudanBhutaneseBlackfeetBolivianBrazilianBritishBritish West IndianBulgarianBurmeseCajunCambodianCanadianCape VerdeanCarpatho RusynCelticCentral AmericanCentral American IndianCherokeeCheyenneChickasawChileanChineseChippewaChoctawColombianColvilleComancheCosta RicanCreeCreekCroatianCrowCubanCypriotCzechCzechoslovakianDanishDelawareDominicanDutchDutch West IndianEastern EuropeanEcuadorianEgyptianEnglishEstonianEthiopianEuropeanFijianFilipinoFinnishFrenchFrench American IndianFrench CanadianGermanGerman RussianGhanaianGreekGuamanian/ChamorroGuatemalanGuyaneseHaitianHmongHonduranHopiHoumaHungarianIcelanderIndian (Asian)IndonesianInupiatIranianIraqiIrishIroquoisIsraeliItalianJamaicanJapaneseJordanianKenyanKiowaKoreanLaotianLatvianLebaneseLiberianLithuanianLumbeeLuxembourgerMacedonianMalaysianMalteseMarshalleseMenomineeMexicanMexican American IndianMongolianMoroccanNative HawaiianNavajoNepaleseNew ZealanderNicaraguanNigerianNorthern EuropeanNorwegianOkinawanOsageOttawaPaiutePakistaniPalestinianPanamanianParaguayanPennsylvania GermanPeruvianPimaPolishPortuguesePotawatomiPuebloPuerto RicanPuget Sound SalishRomanianRussianSalvadoranSamoanScandinavianScotch-IrishScottishSeminoleSenegaleseSerbianShoshoneSierra LeoneanSiouxSlavicSlovakSloveneSomaliSouth AfricanSouth AmericanSouth American IndianSoviet UnionSpaniardSpanishSpanish AmericanSpanish American IndianSri LankanSubsaharan AfricanSudaneseSwedishSwissSyrianTaiwaneseThaiTlingit-HaidaTohono O'OdhamTonganTrinidadian and TobagonianTsimshianTurkishU.S. Virgin IslanderUgandanUkrainianUruguayanUteVenezuelanVietnameseWelshWest IndianYakamaYaquiYugoslavianYumanYup'ikZimbabwean
Immigration
NonimmigrantsImmigrantsAfghanistanAfricaAlbaniaArgentinaArmeniaAsiaAustraliaAustriaBahamasBangladeshBarbadosBelarusBelgiumBelizeBoliviaBosnia and HerzegovinaBrazilBulgariaBurma/MyanmarCabo VerdeCambodiaCameroonCanadaCaribbeanCentral AmericaChileChinaColombiaCongoCosta RicaCroatiaCubaCzechoslovakiaDenmarkDominicaDominican RepublicEastern AfricaEastern AsiaEastern EuropeEcuadorEgyptEl SalvadorEnglandEritreaEthiopiaEuropeFijiFranceGermanyGhanaGreeceGrenadaGuatemalaGuyanaHaitiHondurasHong KongHungaryIndiaIndonesiaIranIraqIrelandIsraelItalyJamaicaJapanJordanKazakhstanKenyaKoreaKuwaitLaosLatin AmericaLatviaLebanonLiberiaLithuaniaMalaysiaMexicoMicronesiaMiddle AfricaMoldovaMoroccoNepalNetherlandsNicaraguaNigeriaNorth AmericaNorth MacedoniaNorthern AfricaNorthern EuropeNorwayOceaniaPakistanPanamaPeruPhilippinesPolandPortugalRomaniaRussiaSaudi ArabiaScotlandSenegalSerbiaSierra LeoneSingaporeSomaliaSouth AfricaSouth AmericaSouth Central AsiaSouth Eastern AsiaSouthern EuropeSpainSri LankaSt. Vincent and the GrenadinesSudanSwedenSwitzerlandSyriaTaiwanThailandTrinidad and TobagoTurkeyUgandaUkraineUruguayUzbekistanVenezuelaVietnamWest IndiesWestern AfricaWestern AsiaWestern EuropeYemenZaireZimbabweAzores
Householder Income Over 65 years
Income
Poverty
Unemployment
Labor Participation
Family Structure
Vehicle Availability
Education Level
Disability

Householder Income Over 65 years Comparison

Whites/Caucasians

British

Tragic
Exceptional
$58,847
HOUSEHOLDER INCOME OVER 65 YEARS
9.8/ 100
METRIC RATING
213th/ 347
METRIC RANK
$63,940
HOUSEHOLDER INCOME OVER 65 YEARS
95.7/ 100
METRIC RATING
103rd/ 347
METRIC RANK

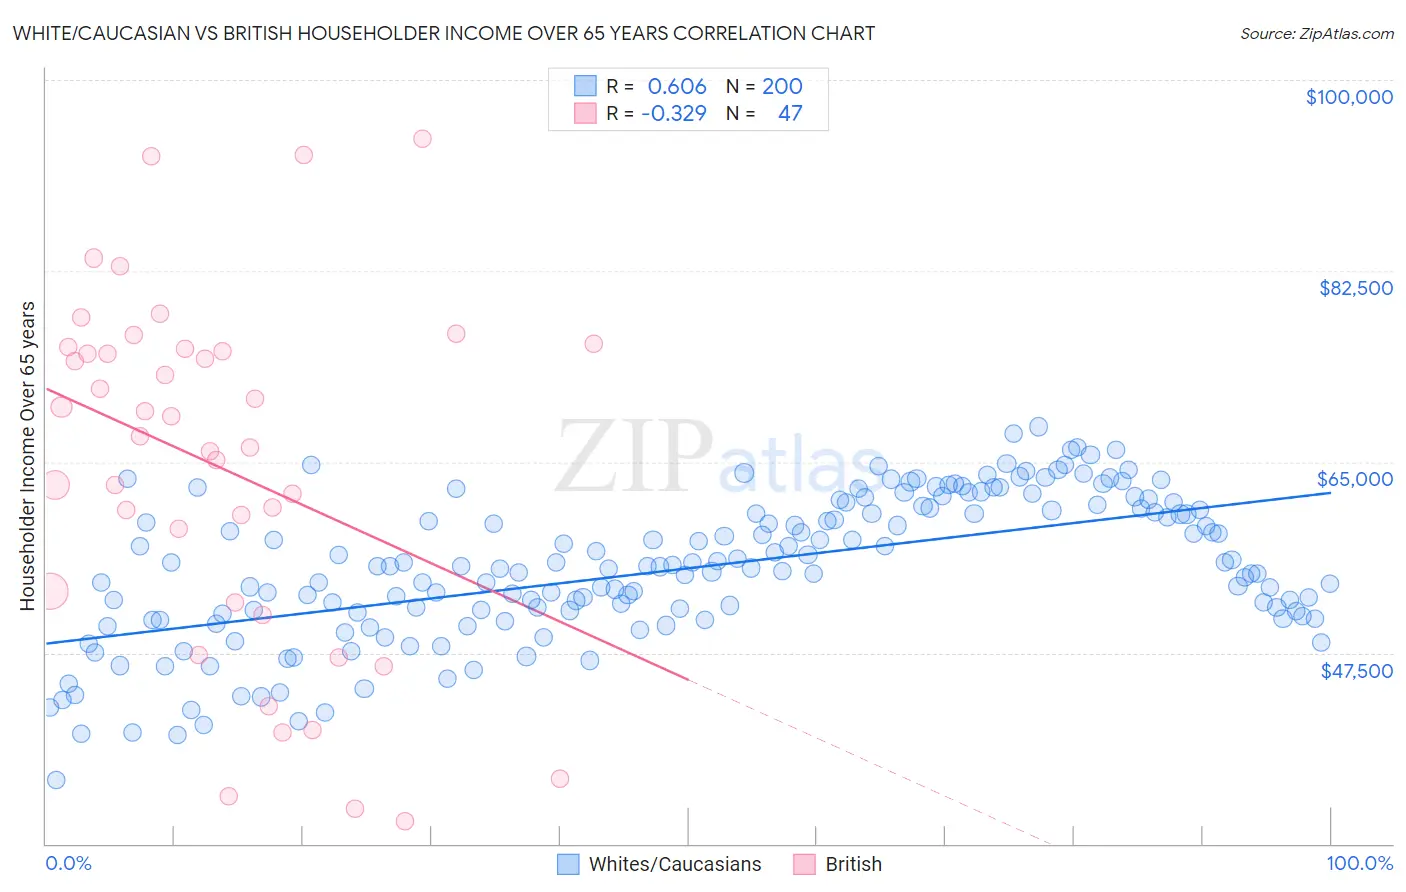
White/Caucasian vs British Householder Income Over 65 years Correlation Chart

The statistical analysis conducted on geographies consisting of 577,509,844 people shows a significant positive correlation between the proportion of Whites/Caucasians and household income with householder over the age of 65 in the United States with a correlation coefficient (R) of 0.606 and weighted average of $58,847. Similarly, the statistical analysis conducted on geographies consisting of 528,237,222 people shows a mild negative correlation between the proportion of British and household income with householder over the age of 65 in the United States with a correlation coefficient (R) of -0.329 and weighted average of $63,940, a difference of 8.6%.
White/Caucasian vs British Householder Income Over 65 years

Householder Income Over 65 years Correlation Summary

MeasurementWhite/CaucasianBritish
Minimum$35,837$32,083
Maximum$68,217$94,602
Range$32,380$62,519
Mean$55,258$64,486
Median$55,418$67,398
Interquartile 25% (IQ1)$51,091$52,155
Interquartile 75% (IQ3)$60,670$75,312
Interquartile Range (IQR)$9,580$23,157
Standard Deviation (Sample)$6,600$16,132
Standard Deviation (Population)$6,583$15,959

Similar Demographics by Householder Income Over 65 years

Demographics Similar to Whites/Caucasians by Householder Income Over 65 years

In terms of householder income over 65 years, the demographic groups most similar to Whites/Caucasians are Colombian ($58,851, a difference of 0.010%), Nepalese ($58,761, a difference of 0.15%), Immigrants from Nigeria ($58,942, a difference of 0.16%), Nigerian ($58,992, a difference of 0.25%), and Slovak ($59,039, a difference of 0.33%).
DemographicsRating | RankHouseholder Income Over 65 years
Immigrants | South America
13.0
/100
|
#206
Poor
$59,151
Salvadorans
12.9
/100
|
#207
Poor
$59,141
Uruguayans
12.3
/100
|
#208
Poor
$59,090
Slovaks
11.7
/100
|
#209
Poor
$59,039
Nigerians
11.2
/100
|
#210
Poor
$58,992
Immigrants | Nigeria
10.7
/100
|
#211
Poor
$58,942
Colombians
9.8
/100
|
#212
Tragic
$58,851
Whites/Caucasians
9.8
/100
|
#213
Tragic
$58,847
Nepalese
9.0
/100
|
#214
Tragic
$58,761
Immigrants | Ghana
7.9
/100
|
#215
Tragic
$58,624
Immigrants | Middle Africa
6.2
/100
|
#216
Tragic
$58,375
Sudanese
5.7
/100
|
#217
Tragic
$58,281
Panamanians
5.6
/100
|
#218
Tragic
$58,266
Malaysians
5.5
/100
|
#219
Tragic
$58,244
Yugoslavians
5.5
/100
|
#220
Tragic
$58,243

Demographics Similar to British by Householder Income Over 65 years

In terms of householder income over 65 years, the demographic groups most similar to British are Chilean ($63,957, a difference of 0.030%), Immigrants from Cameroon ($63,907, a difference of 0.050%), Italian ($63,885, a difference of 0.080%), Immigrants from Argentina ($63,885, a difference of 0.090%), and Pakistani ($63,844, a difference of 0.15%).
DemographicsRating | RankHouseholder Income Over 65 years
Immigrants | Hungary
97.0
/100
|
#96
Exceptional
$64,277
Sri Lankans
96.7
/100
|
#97
Exceptional
$64,201
Romanians
96.5
/100
|
#98
Exceptional
$64,142
Assyrians/Chaldeans/Syriacs
96.4
/100
|
#99
Exceptional
$64,108
Immigrants | South Eastern Asia
96.3
/100
|
#100
Exceptional
$64,089
Immigrants | Italy
96.2
/100
|
#101
Exceptional
$64,065
Chileans
95.8
/100
|
#102
Exceptional
$63,957
British
95.7
/100
|
#103
Exceptional
$63,940
Immigrants | Cameroon
95.6
/100
|
#104
Exceptional
$63,907
Italians
95.5
/100
|
#105
Exceptional
$63,885
Immigrants | Argentina
95.5
/100
|
#106
Exceptional
$63,885
Pakistanis
95.3
/100
|
#107
Exceptional
$63,844
Palestinians
95.1
/100
|
#108
Exceptional
$63,800
Europeans
95.0
/100
|
#109
Exceptional
$63,779
Immigrants | Zimbabwe
94.3
/100
|
#110
Exceptional
$63,643