White/Caucasian vs Syrian Householder Income Over 65 years
COMPARE
White/Caucasian
Syrian
Householder Income Over 65 years
Householder Income Over 65 years Comparison
Whites/Caucasians
Syrians
$58,847
HOUSEHOLDER INCOME OVER 65 YEARS
9.8/ 100
METRIC RATING
213th/ 347
METRIC RANK
$63,494
HOUSEHOLDER INCOME OVER 65 YEARS
93.4/ 100
METRIC RATING
112th/ 347
METRIC RANK
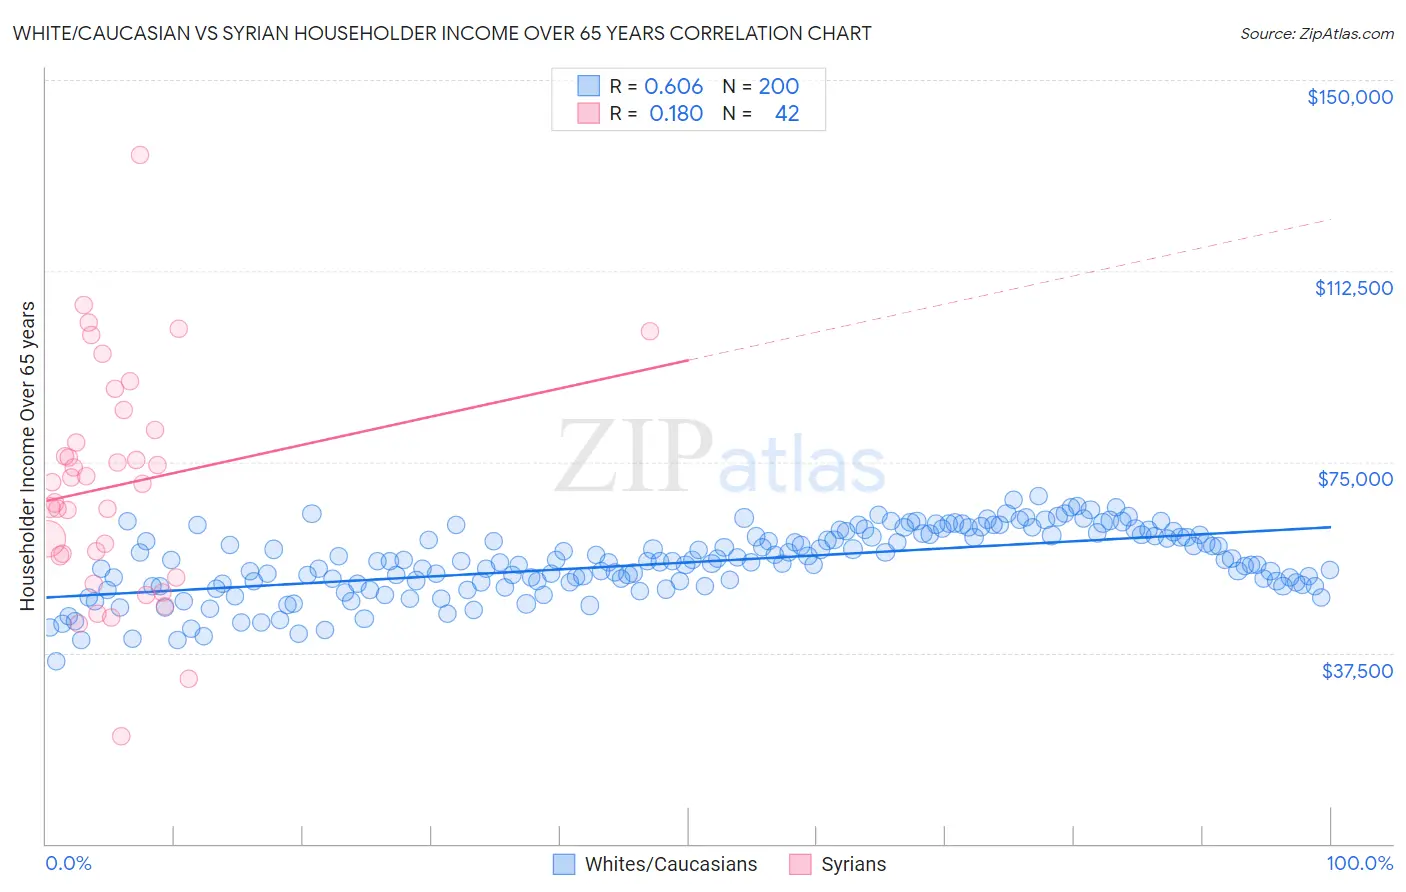
White/Caucasian vs Syrian Householder Income Over 65 years Correlation Chart
The statistical analysis conducted on geographies consisting of 577,509,844 people shows a significant positive correlation between the proportion of Whites/Caucasians and household income with householder over the age of 65 in the United States with a correlation coefficient (R) of 0.606 and weighted average of $58,847. Similarly, the statistical analysis conducted on geographies consisting of 265,818,751 people shows a poor positive correlation between the proportion of Syrians and household income with householder over the age of 65 in the United States with a correlation coefficient (R) of 0.180 and weighted average of $63,494, a difference of 7.9%.
Householder Income Over 65 years Correlation Summary
| Measurement | White/Caucasian | Syrian |
| Minimum | $35,837 | $21,115 |
| Maximum | $68,217 | $135,278 |
| Range | $32,380 | $114,162 |
| Mean | $55,258 | $70,420 |
| Median | $55,418 | $70,855 |
| Interquartile 25% (IQ1) | $51,091 | $56,590 |
| Interquartile 75% (IQ3) | $60,670 | $81,250 |
| Interquartile Range (IQR) | $9,580 | $24,660 |
| Standard Deviation (Sample) | $6,600 | $22,192 |
| Standard Deviation (Population) | $6,583 | $21,926 |
Similar Demographics by Householder Income Over 65 years
Demographics Similar to Whites/Caucasians by Householder Income Over 65 years
In terms of householder income over 65 years, the demographic groups most similar to Whites/Caucasians are Colombian ($58,851, a difference of 0.010%), Nepalese ($58,761, a difference of 0.15%), Immigrants from Nigeria ($58,942, a difference of 0.16%), Nigerian ($58,992, a difference of 0.25%), and Slovak ($59,039, a difference of 0.33%).
| Demographics | Rating | Rank | Householder Income Over 65 years |
| Immigrants | South America | 13.0 /100 | #206 | Poor $59,151 |
| Salvadorans | 12.9 /100 | #207 | Poor $59,141 |
| Uruguayans | 12.3 /100 | #208 | Poor $59,090 |
| Slovaks | 11.7 /100 | #209 | Poor $59,039 |
| Nigerians | 11.2 /100 | #210 | Poor $58,992 |
| Immigrants | Nigeria | 10.7 /100 | #211 | Poor $58,942 |
| Colombians | 9.8 /100 | #212 | Tragic $58,851 |
| Whites/Caucasians | 9.8 /100 | #213 | Tragic $58,847 |
| Nepalese | 9.0 /100 | #214 | Tragic $58,761 |
| Immigrants | Ghana | 7.9 /100 | #215 | Tragic $58,624 |
| Immigrants | Middle Africa | 6.2 /100 | #216 | Tragic $58,375 |
| Sudanese | 5.7 /100 | #217 | Tragic $58,281 |
| Panamanians | 5.6 /100 | #218 | Tragic $58,266 |
| Malaysians | 5.5 /100 | #219 | Tragic $58,244 |
| Yugoslavians | 5.5 /100 | #220 | Tragic $58,243 |
Demographics Similar to Syrians by Householder Income Over 65 years
In terms of householder income over 65 years, the demographic groups most similar to Syrians are Immigrants from Spain ($63,540, a difference of 0.070%), Immigrants from Serbia ($63,387, a difference of 0.17%), Immigrants from Saudi Arabia ($63,355, a difference of 0.22%), Immigrants from Zimbabwe ($63,643, a difference of 0.24%), and Croatian ($63,225, a difference of 0.43%).
| Demographics | Rating | Rank | Householder Income Over 65 years |
| Italians | 95.5 /100 | #105 | Exceptional $63,885 |
| Immigrants | Argentina | 95.5 /100 | #106 | Exceptional $63,885 |
| Pakistanis | 95.3 /100 | #107 | Exceptional $63,844 |
| Palestinians | 95.1 /100 | #108 | Exceptional $63,800 |
| Europeans | 95.0 /100 | #109 | Exceptional $63,779 |
| Immigrants | Zimbabwe | 94.3 /100 | #110 | Exceptional $63,643 |
| Immigrants | Spain | 93.7 /100 | #111 | Exceptional $63,540 |
| Syrians | 93.4 /100 | #112 | Exceptional $63,494 |
| Immigrants | Serbia | 92.7 /100 | #113 | Exceptional $63,387 |
| Immigrants | Saudi Arabia | 92.4 /100 | #114 | Exceptional $63,355 |
| Croatians | 91.4 /100 | #115 | Exceptional $63,225 |
| Guamanians/Chamorros | 91.1 /100 | #116 | Exceptional $63,187 |
| Immigrants | Croatia | 90.9 /100 | #117 | Exceptional $63,168 |
| Danes | 90.5 /100 | #118 | Exceptional $63,117 |
| Immigrants | Jordan | 89.8 /100 | #119 | Excellent $63,041 |