Ute vs Central American Wage/Income Gap
COMPARE
Ute
Central American
Wage/Income Gap
Wage/Income Gap Comparison
Ute
Central Americans
27.8%
WAGE/INCOME GAP
0.8/ 100
METRIC RATING
271st/ 347
METRIC RANK
23.1%
WAGE/INCOME GAP
99.8/ 100
METRIC RATING
82nd/ 347
METRIC RANK
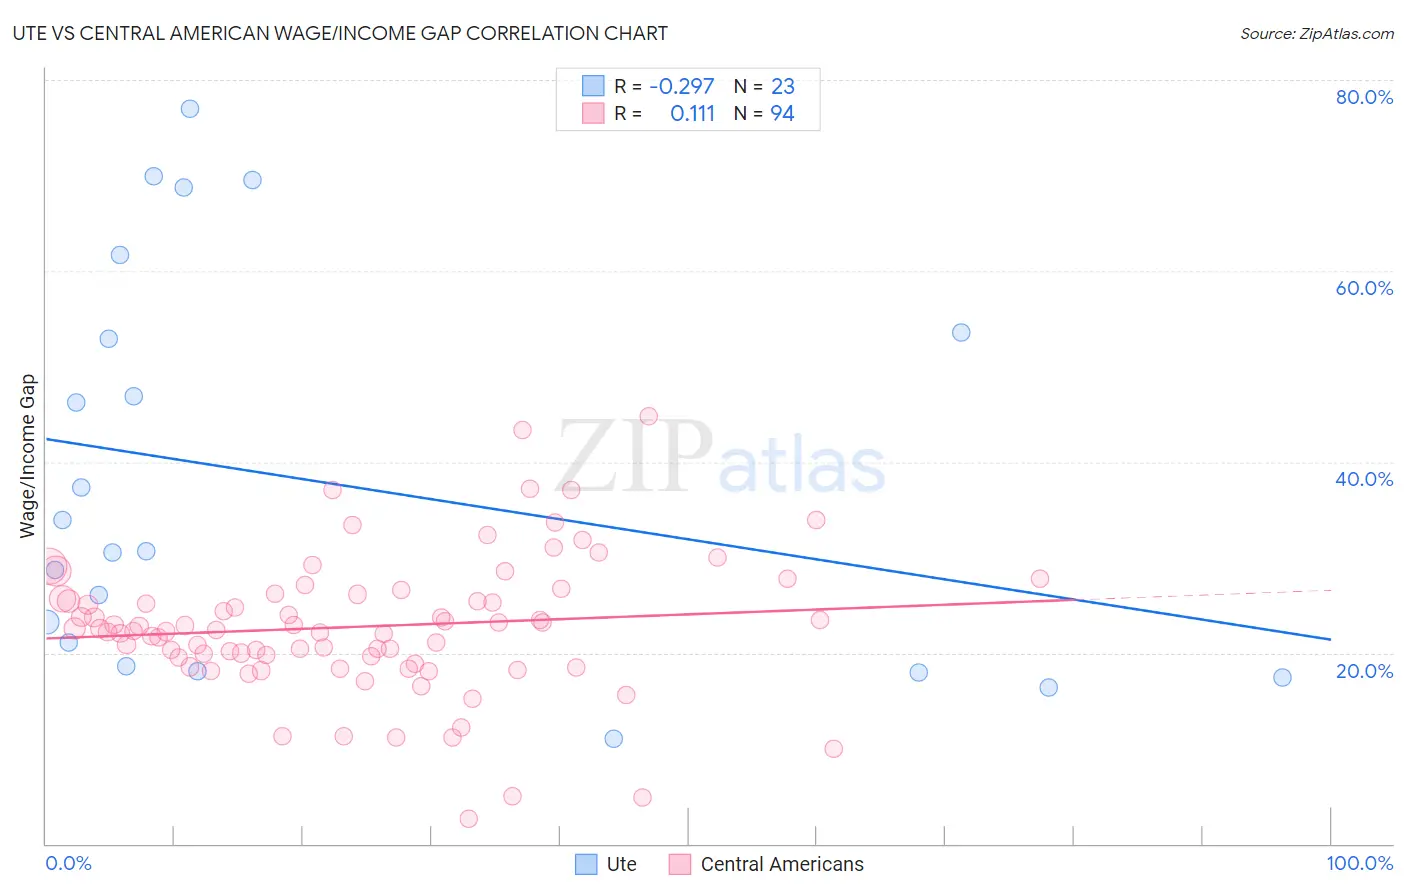
Ute vs Central American Wage/Income Gap Correlation Chart
The statistical analysis conducted on geographies consisting of 55,649,950 people shows a weak negative correlation between the proportion of Ute and wage/income gap percentage in the United States with a correlation coefficient (R) of -0.297 and weighted average of 27.8%. Similarly, the statistical analysis conducted on geographies consisting of 503,863,449 people shows a poor positive correlation between the proportion of Central Americans and wage/income gap percentage in the United States with a correlation coefficient (R) of 0.111 and weighted average of 23.1%, a difference of 20.2%.
Wage/Income Gap Correlation Summary
| Measurement | Ute | Central American |
| Minimum | 11.0% | 2.7% |
| Maximum | 77.0% | 44.8% |
| Range | 66.0% | 42.2% |
| Mean | 38.1% | 22.7% |
| Median | 30.6% | 22.5% |
| Interquartile 25% (IQ1) | 18.6% | 19.5% |
| Interquartile 75% (IQ3) | 53.5% | 26.1% |
| Interquartile Range (IQR) | 34.9% | 6.6% |
| Standard Deviation (Sample) | 20.6% | 7.2% |
| Standard Deviation (Population) | 20.1% | 7.2% |
Similar Demographics by Wage/Income Gap
Demographics Similar to Ute by Wage/Income Gap
In terms of wage/income gap, the demographic groups most similar to Ute are Immigrants from Korea (27.8%, a difference of 0.070%), Immigrants from Western Europe (27.8%, a difference of 0.080%), Bulgarian (27.8%, a difference of 0.18%), Potawatomi (27.7%, a difference of 0.20%), and New Zealander (27.7%, a difference of 0.21%).
| Demographics | Rating | Rank | Wage/Income Gap |
| Immigrants | Switzerland | 1.0 /100 | #264 | Tragic 27.7% |
| Serbians | 1.0 /100 | #265 | Tragic 27.7% |
| Hmong | 1.0 /100 | #266 | Tragic 27.7% |
| Turks | 1.0 /100 | #267 | Tragic 27.7% |
| New Zealanders | 1.0 /100 | #268 | Tragic 27.7% |
| Potawatomi | 0.9 /100 | #269 | Tragic 27.7% |
| Immigrants | Western Europe | 0.9 /100 | #270 | Tragic 27.8% |
| Ute | 0.8 /100 | #271 | Tragic 27.8% |
| Immigrants | Korea | 0.8 /100 | #272 | Tragic 27.8% |
| Bulgarians | 0.7 /100 | #273 | Tragic 27.8% |
| Americans | 0.7 /100 | #274 | Tragic 27.8% |
| Immigrants | Japan | 0.7 /100 | #275 | Tragic 27.9% |
| Lebanese | 0.7 /100 | #276 | Tragic 27.9% |
| Latvians | 0.7 /100 | #277 | Tragic 27.9% |
| Immigrants | England | 0.6 /100 | #278 | Tragic 27.9% |
Demographics Similar to Central Americans by Wage/Income Gap
In terms of wage/income gap, the demographic groups most similar to Central Americans are Bermudan (23.1%, a difference of 0.0%), Immigrants from Africa (23.2%, a difference of 0.29%), Salvadoran (23.0%, a difference of 0.47%), Immigrants from Nicaragua (23.0%, a difference of 0.54%), and Nigerian (23.0%, a difference of 0.62%).
| Demographics | Rating | Rank | Wage/Income Gap |
| Fijians | 99.9 /100 | #75 | Exceptional 22.9% |
| Ecuadorians | 99.9 /100 | #76 | Exceptional 22.9% |
| Africans | 99.9 /100 | #77 | Exceptional 22.9% |
| Nigerians | 99.9 /100 | #78 | Exceptional 23.0% |
| Immigrants | Nicaragua | 99.9 /100 | #79 | Exceptional 23.0% |
| Salvadorans | 99.9 /100 | #80 | Exceptional 23.0% |
| Bermudans | 99.8 /100 | #81 | Exceptional 23.1% |
| Central Americans | 99.8 /100 | #82 | Exceptional 23.1% |
| Immigrants | Africa | 99.8 /100 | #83 | Exceptional 23.2% |
| Cubans | 99.7 /100 | #84 | Exceptional 23.3% |
| Immigrants | Cambodia | 99.7 /100 | #85 | Exceptional 23.3% |
| Cheyenne | 99.7 /100 | #86 | Exceptional 23.3% |
| Yuman | 99.7 /100 | #87 | Exceptional 23.3% |
| Immigrants | Panama | 99.6 /100 | #88 | Exceptional 23.4% |
| Marshallese | 99.6 /100 | #89 | Exceptional 23.4% |