Ute vs Central American Unemployment Among Women with Children Under 6 years
COMPARE
Ute
Central American
Unemployment Among Women with Children Under 6 years
Unemployment Among Women with Children Under 6 years Comparison
Ute
Central Americans
6.5%
UNEMPLOYMENT AMONG WOMEN WITH CHILDREN UNDER 6 YEARS
100.0/ 100
METRIC RATING
20th/ 347
METRIC RANK
8.2%
UNEMPLOYMENT AMONG WOMEN WITH CHILDREN UNDER 6 YEARS
1.4/ 100
METRIC RATING
246th/ 347
METRIC RANK
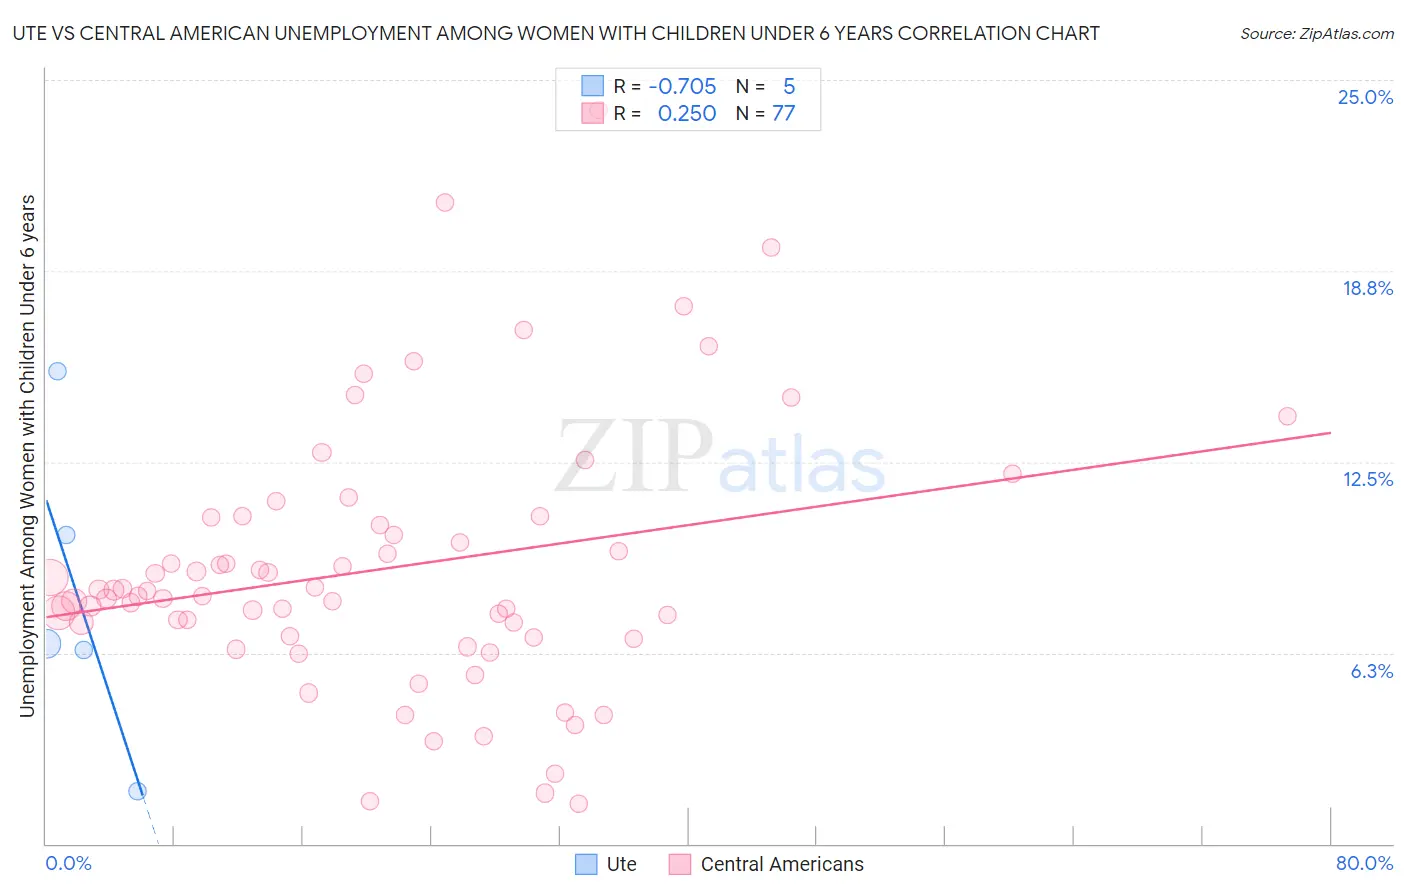
Ute vs Central American Unemployment Among Women with Children Under 6 years Correlation Chart
The statistical analysis conducted on geographies consisting of 51,284,469 people shows a strong negative correlation between the proportion of Ute and unemployment rate among women with children under the age of 6 in the United States with a correlation coefficient (R) of -0.705 and weighted average of 6.5%. Similarly, the statistical analysis conducted on geographies consisting of 361,380,642 people shows a weak positive correlation between the proportion of Central Americans and unemployment rate among women with children under the age of 6 in the United States with a correlation coefficient (R) of 0.250 and weighted average of 8.2%, a difference of 26.4%.
Unemployment Among Women with Children Under 6 years Correlation Summary
| Measurement | Ute | Central American |
| Minimum | 1.7% | 1.3% |
| Maximum | 15.5% | 24.0% |
| Range | 13.8% | 22.7% |
| Mean | 8.0% | 9.0% |
| Median | 6.5% | 8.1% |
| Interquartile 25% (IQ1) | 4.0% | 6.8% |
| Interquartile 75% (IQ3) | 12.8% | 10.5% |
| Interquartile Range (IQR) | 8.8% | 3.8% |
| Standard Deviation (Sample) | 5.1% | 4.3% |
| Standard Deviation (Population) | 4.6% | 4.3% |
Similar Demographics by Unemployment Among Women with Children Under 6 years
Demographics Similar to Ute by Unemployment Among Women with Children Under 6 years
In terms of unemployment among women with children under 6 years, the demographic groups most similar to Ute are Mongolian (6.5%, a difference of 0.050%), Burmese (6.5%, a difference of 0.050%), Assyrian/Chaldean/Syriac (6.5%, a difference of 0.38%), Immigrants from Korea (6.5%, a difference of 0.47%), and Bulgarian (6.5%, a difference of 0.67%).
| Demographics | Rating | Rank | Unemployment Among Women with Children Under 6 years |
| Immigrants | Eastern Asia | 100.0 /100 | #13 | Exceptional 6.3% |
| Immigrants | Bulgaria | 100.0 /100 | #14 | Exceptional 6.3% |
| Thais | 100.0 /100 | #15 | Exceptional 6.3% |
| Immigrants | Uzbekistan | 100.0 /100 | #16 | Exceptional 6.3% |
| Immigrants | Malaysia | 100.0 /100 | #17 | Exceptional 6.4% |
| Assyrians/Chaldeans/Syriacs | 100.0 /100 | #18 | Exceptional 6.5% |
| Mongolians | 100.0 /100 | #19 | Exceptional 6.5% |
| Ute | 100.0 /100 | #20 | Exceptional 6.5% |
| Burmese | 100.0 /100 | #21 | Exceptional 6.5% |
| Immigrants | Korea | 100.0 /100 | #22 | Exceptional 6.5% |
| Bulgarians | 100.0 /100 | #23 | Exceptional 6.5% |
| Laotians | 100.0 /100 | #24 | Exceptional 6.5% |
| Soviet Union | 100.0 /100 | #25 | Exceptional 6.5% |
| Cypriots | 100.0 /100 | #26 | Exceptional 6.5% |
| Immigrants | Japan | 100.0 /100 | #27 | Exceptional 6.5% |
Demographics Similar to Central Americans by Unemployment Among Women with Children Under 6 years
In terms of unemployment among women with children under 6 years, the demographic groups most similar to Central Americans are German Russian (8.2%, a difference of 0.28%), Immigrants from Western Africa (8.2%, a difference of 0.32%), Native Hawaiian (8.2%, a difference of 0.33%), French (8.2%, a difference of 0.34%), and Hawaiian (8.2%, a difference of 0.37%).
| Demographics | Rating | Rank | Unemployment Among Women with Children Under 6 years |
| Irish | 2.7 /100 | #239 | Tragic 8.1% |
| Immigrants | El Salvador | 2.6 /100 | #240 | Tragic 8.1% |
| Liberians | 2.6 /100 | #241 | Tragic 8.1% |
| Dutch | 2.5 /100 | #242 | Tragic 8.1% |
| Hawaiians | 1.8 /100 | #243 | Tragic 8.2% |
| French | 1.7 /100 | #244 | Tragic 8.2% |
| Native Hawaiians | 1.7 /100 | #245 | Tragic 8.2% |
| Central Americans | 1.4 /100 | #246 | Tragic 8.2% |
| German Russians | 1.2 /100 | #247 | Tragic 8.2% |
| Immigrants | Western Africa | 1.1 /100 | #248 | Tragic 8.2% |
| Immigrants | Sierra Leone | 1.1 /100 | #249 | Tragic 8.2% |
| Nigerians | 1.1 /100 | #250 | Tragic 8.2% |
| Guyanese | 1.0 /100 | #251 | Tragic 8.2% |
| Ghanaians | 1.0 /100 | #252 | Tragic 8.2% |
| Immigrants | Guyana | 0.8 /100 | #253 | Tragic 8.2% |