Ute vs Central American 8th Grade
COMPARE
Ute
Central American
8th Grade
8th Grade Comparison
Ute
Central Americans
95.8%
8TH GRADE
58.5/ 100
METRIC RATING
170th/ 347
METRIC RANK
91.6%
8TH GRADE
0.0/ 100
METRIC RATING
338th/ 347
METRIC RANK
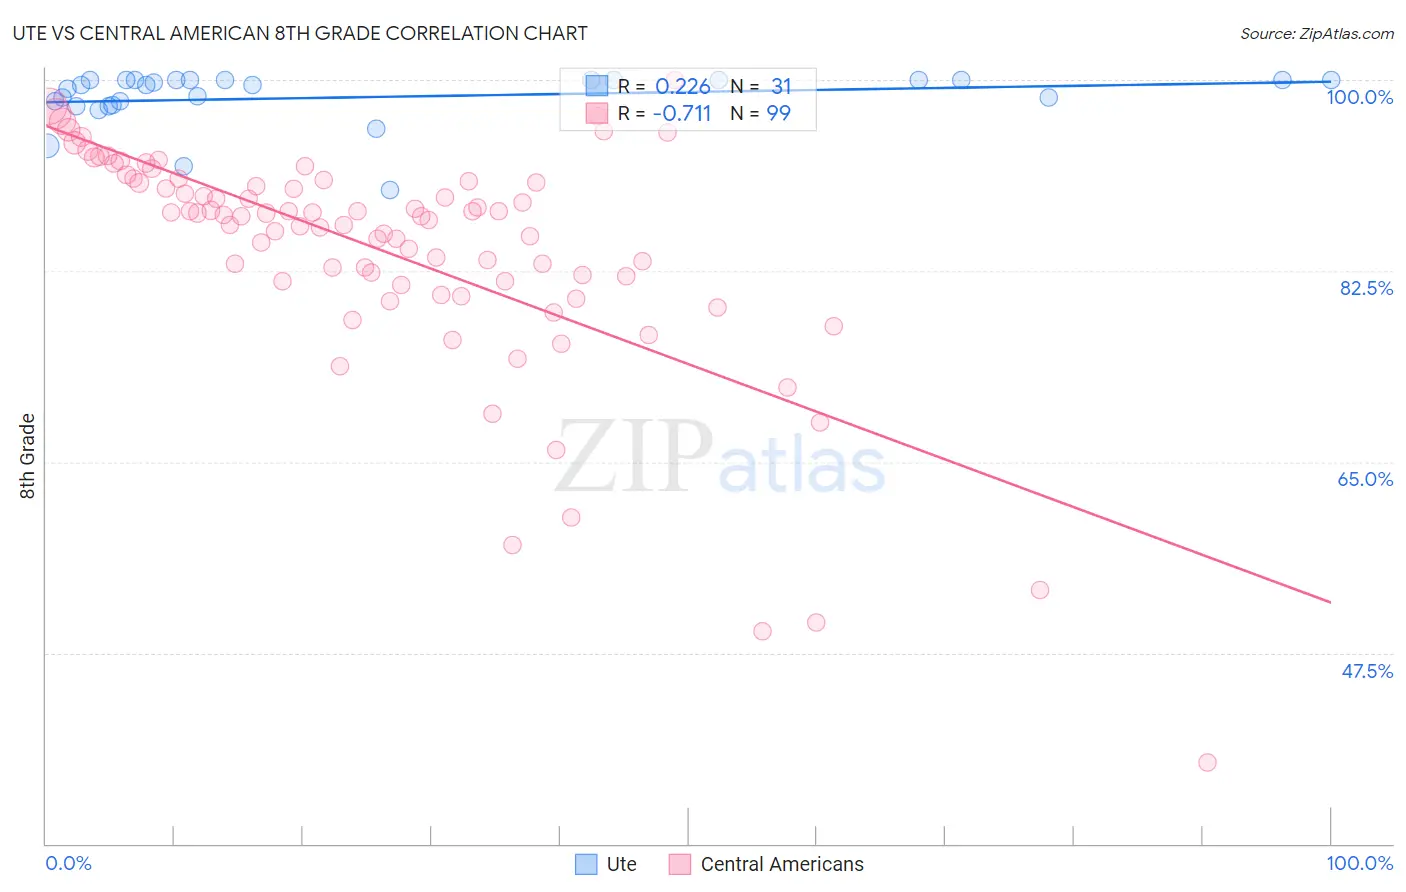
Ute vs Central American 8th Grade Correlation Chart
The statistical analysis conducted on geographies consisting of 55,668,539 people shows a weak positive correlation between the proportion of Ute and percentage of population with at least 8th grade education in the United States with a correlation coefficient (R) of 0.226 and weighted average of 95.8%. Similarly, the statistical analysis conducted on geographies consisting of 504,619,347 people shows a strong negative correlation between the proportion of Central Americans and percentage of population with at least 8th grade education in the United States with a correlation coefficient (R) of -0.711 and weighted average of 91.6%, a difference of 4.6%.
8th Grade Correlation Summary
| Measurement | Ute | Central American |
| Minimum | 89.9% | 37.5% |
| Maximum | 100.0% | 100.0% |
| Range | 10.1% | 62.5% |
| Mean | 98.4% | 84.3% |
| Median | 99.5% | 87.6% |
| Interquartile 25% (IQ1) | 97.7% | 81.6% |
| Interquartile 75% (IQ3) | 100.0% | 90.8% |
| Interquartile Range (IQR) | 2.3% | 9.2% |
| Standard Deviation (Sample) | 2.5% | 10.8% |
| Standard Deviation (Population) | 2.4% | 10.7% |
Similar Demographics by 8th Grade
Demographics Similar to Ute by 8th Grade
In terms of 8th grade, the demographic groups most similar to Ute are Immigrants from Iran (95.8%, a difference of 0.0%), Egyptian (95.8%, a difference of 0.0%), Immigrants from Korea (95.8%, a difference of 0.0%), Spaniard (95.8%, a difference of 0.010%), and Immigrants from Ukraine (95.8%, a difference of 0.010%).
| Demographics | Rating | Rank | 8th Grade |
| Immigrants | Sri Lanka | 64.1 /100 | #163 | Good 95.8% |
| Immigrants | Italy | 63.5 /100 | #164 | Good 95.8% |
| Alsatians | 61.4 /100 | #165 | Good 95.8% |
| Immigrants | Poland | 61.1 /100 | #166 | Good 95.8% |
| Spaniards | 60.0 /100 | #167 | Good 95.8% |
| Immigrants | Ukraine | 59.5 /100 | #168 | Average 95.8% |
| Immigrants | Iran | 58.6 /100 | #169 | Average 95.8% |
| Ute | 58.5 /100 | #170 | Average 95.8% |
| Egyptians | 58.2 /100 | #171 | Average 95.8% |
| Immigrants | Korea | 57.9 /100 | #172 | Average 95.8% |
| Mongolians | 53.0 /100 | #173 | Average 95.8% |
| Chileans | 50.0 /100 | #174 | Average 95.7% |
| Immigrants | Albania | 49.6 /100 | #175 | Average 95.7% |
| Pakistanis | 48.8 /100 | #176 | Average 95.7% |
| Marshallese | 47.6 /100 | #177 | Average 95.7% |
Demographics Similar to Central Americans by 8th Grade
In terms of 8th grade, the demographic groups most similar to Central Americans are Immigrants from Latin America (91.7%, a difference of 0.14%), Mexican (91.4%, a difference of 0.23%), Yakama (91.2%, a difference of 0.36%), Immigrants from Honduras (91.9%, a difference of 0.37%), and Guatemalan (91.1%, a difference of 0.47%).
| Demographics | Rating | Rank | 8th Grade |
| Hondurans | 0.0 /100 | #331 | Tragic 92.3% |
| Immigrants | Dominican Republic | 0.0 /100 | #332 | Tragic 92.3% |
| Hispanics or Latinos | 0.0 /100 | #333 | Tragic 92.2% |
| Immigrants | Yemen | 0.0 /100 | #334 | Tragic 92.1% |
| Mexican American Indians | 0.0 /100 | #335 | Tragic 92.1% |
| Immigrants | Honduras | 0.0 /100 | #336 | Tragic 91.9% |
| Immigrants | Latin America | 0.0 /100 | #337 | Tragic 91.7% |
| Central Americans | 0.0 /100 | #338 | Tragic 91.6% |
| Mexicans | 0.0 /100 | #339 | Tragic 91.4% |
| Yakama | 0.0 /100 | #340 | Tragic 91.2% |
| Guatemalans | 0.0 /100 | #341 | Tragic 91.1% |
| Salvadorans | 0.0 /100 | #342 | Tragic 90.9% |
| Immigrants | Guatemala | 0.0 /100 | #343 | Tragic 90.7% |
| Immigrants | Central America | 0.0 /100 | #344 | Tragic 90.4% |
| Immigrants | El Salvador | 0.0 /100 | #345 | Tragic 90.3% |