Ute vs Czech Wage/Income Gap
COMPARE
Ute
Czech
Wage/Income Gap
Wage/Income Gap Comparison
Ute
Czechs
27.8%
WAGE/INCOME GAP
0.8/ 100
METRIC RATING
271st/ 347
METRIC RANK
29.2%
WAGE/INCOME GAP
0.0/ 100
METRIC RATING
331st/ 347
METRIC RANK
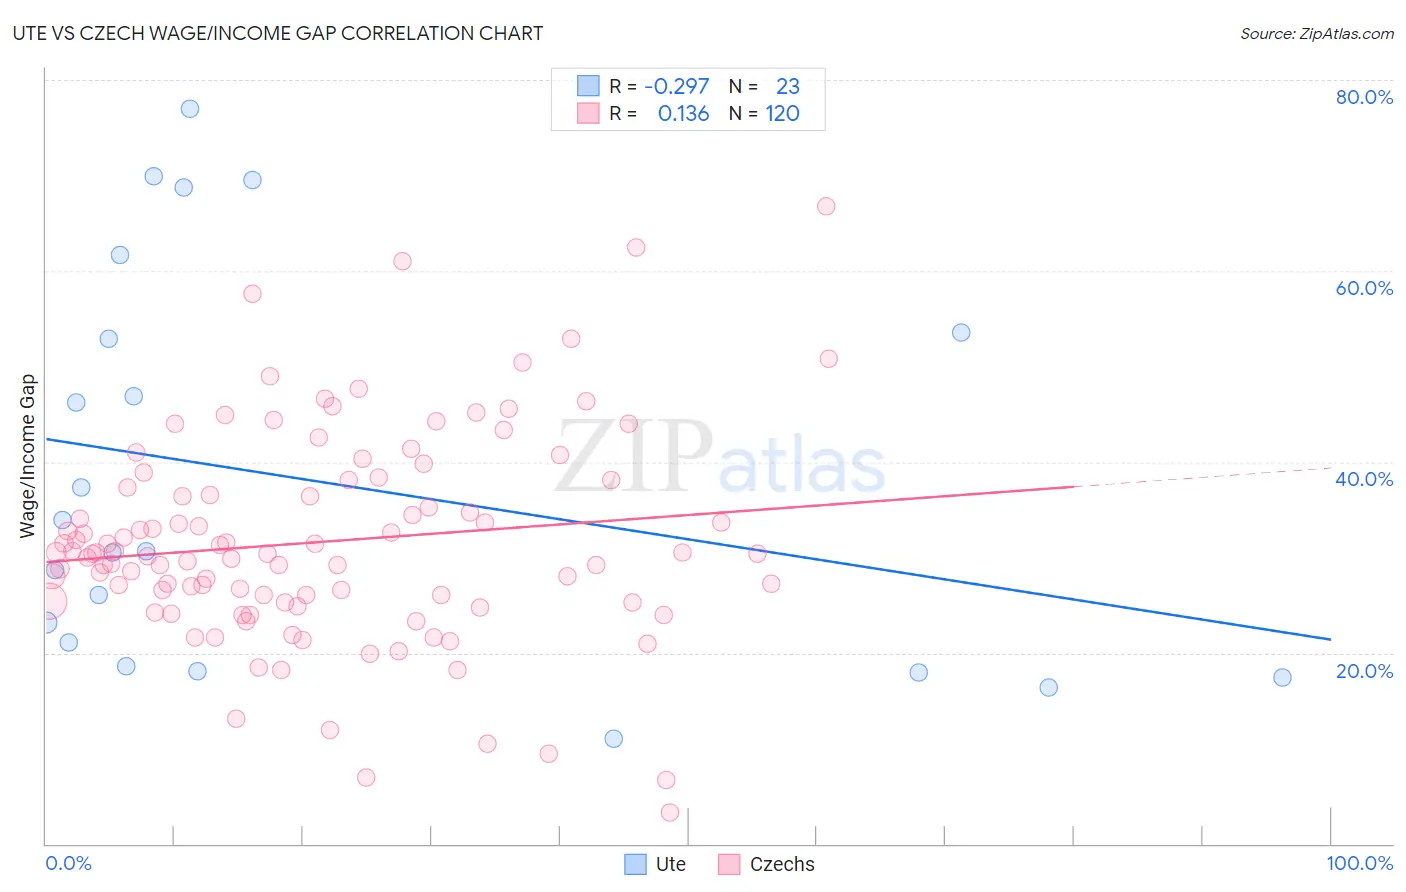
Ute vs Czech Wage/Income Gap Correlation Chart
The statistical analysis conducted on geographies consisting of 55,649,950 people shows a weak negative correlation between the proportion of Ute and wage/income gap percentage in the United States with a correlation coefficient (R) of -0.297 and weighted average of 27.8%. Similarly, the statistical analysis conducted on geographies consisting of 484,001,232 people shows a poor positive correlation between the proportion of Czechs and wage/income gap percentage in the United States with a correlation coefficient (R) of 0.136 and weighted average of 29.2%, a difference of 5.0%.
Wage/Income Gap Correlation Summary
| Measurement | Ute | Czech |
| Minimum | 11.0% | 3.2% |
| Maximum | 77.0% | 66.7% |
| Range | 66.0% | 63.5% |
| Mean | 38.1% | 31.6% |
| Median | 30.6% | 30.4% |
| Interquartile 25% (IQ1) | 18.6% | 25.4% |
| Interquartile 75% (IQ3) | 53.5% | 37.7% |
| Interquartile Range (IQR) | 34.9% | 12.3% |
| Standard Deviation (Sample) | 20.6% | 11.1% |
| Standard Deviation (Population) | 20.1% | 11.0% |
Similar Demographics by Wage/Income Gap
Demographics Similar to Ute by Wage/Income Gap
In terms of wage/income gap, the demographic groups most similar to Ute are Immigrants from Korea (27.8%, a difference of 0.070%), Immigrants from Western Europe (27.8%, a difference of 0.080%), Bulgarian (27.8%, a difference of 0.18%), Potawatomi (27.7%, a difference of 0.20%), and New Zealander (27.7%, a difference of 0.21%).
| Demographics | Rating | Rank | Wage/Income Gap |
| Immigrants | Switzerland | 1.0 /100 | #264 | Tragic 27.7% |
| Serbians | 1.0 /100 | #265 | Tragic 27.7% |
| Hmong | 1.0 /100 | #266 | Tragic 27.7% |
| Turks | 1.0 /100 | #267 | Tragic 27.7% |
| New Zealanders | 1.0 /100 | #268 | Tragic 27.7% |
| Potawatomi | 0.9 /100 | #269 | Tragic 27.7% |
| Immigrants | Western Europe | 0.9 /100 | #270 | Tragic 27.8% |
| Ute | 0.8 /100 | #271 | Tragic 27.8% |
| Immigrants | Korea | 0.8 /100 | #272 | Tragic 27.8% |
| Bulgarians | 0.7 /100 | #273 | Tragic 27.8% |
| Americans | 0.7 /100 | #274 | Tragic 27.8% |
| Immigrants | Japan | 0.7 /100 | #275 | Tragic 27.9% |
| Lebanese | 0.7 /100 | #276 | Tragic 27.9% |
| Latvians | 0.7 /100 | #277 | Tragic 27.9% |
| Immigrants | England | 0.6 /100 | #278 | Tragic 27.9% |
Demographics Similar to Czechs by Wage/Income Gap
In terms of wage/income gap, the demographic groups most similar to Czechs are German (29.2%, a difference of 0.050%), Scottish (29.1%, a difference of 0.15%), Scandinavian (29.1%, a difference of 0.29%), Immigrants from Iran (29.1%, a difference of 0.35%), and Immigrants from Belgium (29.0%, a difference of 0.46%).
| Demographics | Rating | Rank | Wage/Income Gap |
| Croatians | 0.0 /100 | #324 | Tragic 29.0% |
| Hungarians | 0.0 /100 | #325 | Tragic 29.0% |
| Immigrants | Belgium | 0.0 /100 | #326 | Tragic 29.0% |
| Immigrants | Iran | 0.0 /100 | #327 | Tragic 29.1% |
| Scandinavians | 0.0 /100 | #328 | Tragic 29.1% |
| Scottish | 0.0 /100 | #329 | Tragic 29.1% |
| Germans | 0.0 /100 | #330 | Tragic 29.2% |
| Czechs | 0.0 /100 | #331 | Tragic 29.2% |
| Immigrants | South Central Asia | 0.0 /100 | #332 | Tragic 29.3% |
| Europeans | 0.0 /100 | #333 | Tragic 29.4% |
| Swedes | 0.0 /100 | #334 | Tragic 29.4% |
| Immigrants | Taiwan | 0.0 /100 | #335 | Tragic 29.5% |
| English | 0.0 /100 | #336 | Tragic 29.5% |
| Dutch | 0.0 /100 | #337 | Tragic 29.6% |
| Filipinos | 0.0 /100 | #338 | Tragic 29.7% |