Immigrants from South Central Asia vs Dutch Wage/Income Gap
COMPARE
Immigrants from South Central Asia
Dutch
Wage/Income Gap
Wage/Income Gap Comparison
Immigrants from South Central Asia
Dutch
29.3%
WAGE/INCOME GAP
0.0/ 100
METRIC RATING
332nd/ 347
METRIC RANK
29.6%
WAGE/INCOME GAP
0.0/ 100
METRIC RATING
337th/ 347
METRIC RANK
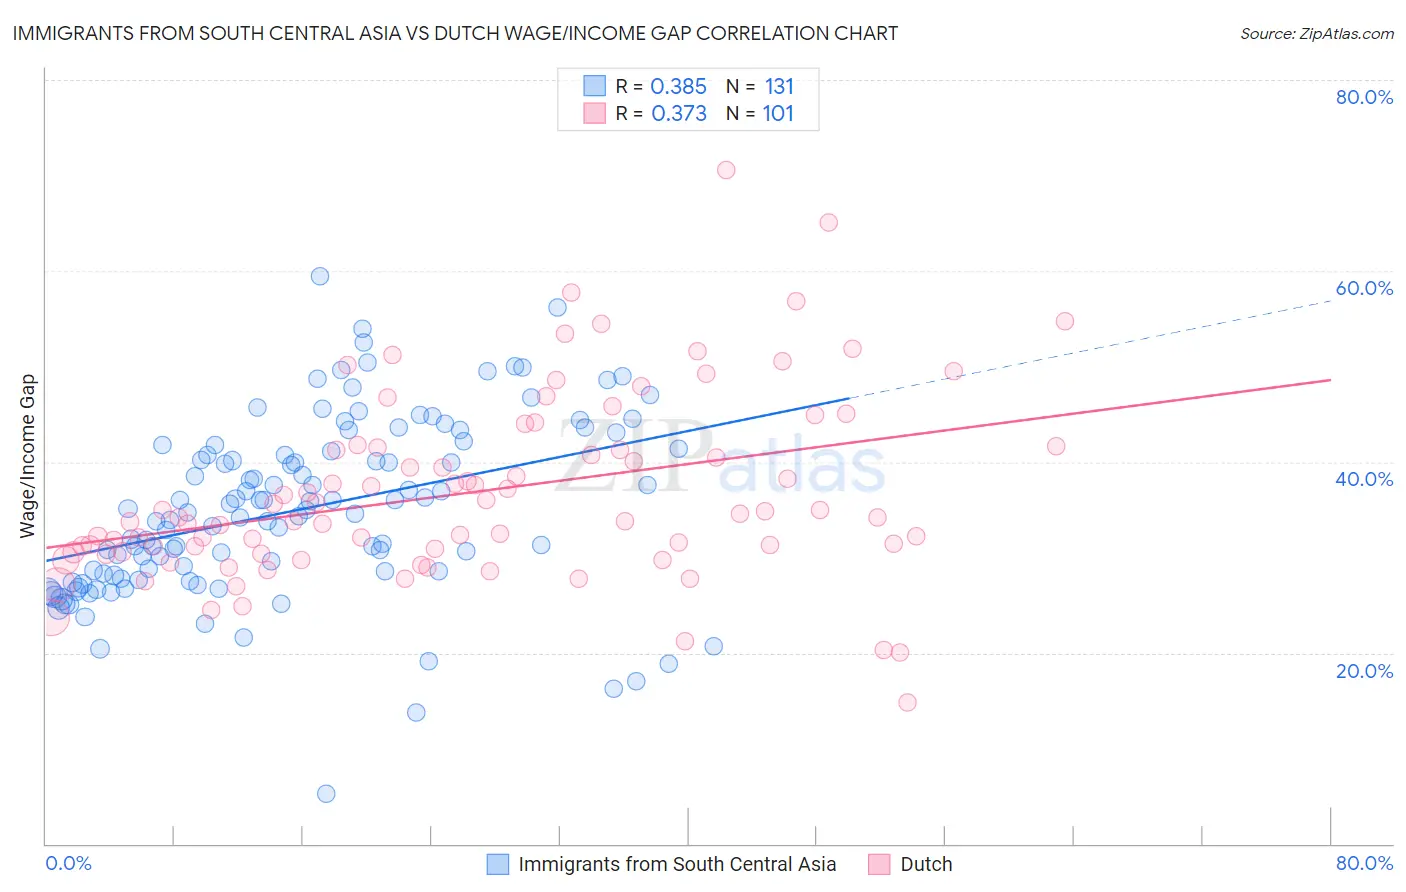
Immigrants from South Central Asia vs Dutch Wage/Income Gap Correlation Chart
The statistical analysis conducted on geographies consisting of 472,660,484 people shows a mild positive correlation between the proportion of Immigrants from South Central Asia and wage/income gap percentage in the United States with a correlation coefficient (R) of 0.385 and weighted average of 29.3%. Similarly, the statistical analysis conducted on geographies consisting of 552,244,152 people shows a mild positive correlation between the proportion of Dutch and wage/income gap percentage in the United States with a correlation coefficient (R) of 0.373 and weighted average of 29.6%, a difference of 1.1%.
Wage/Income Gap Correlation Summary
| Measurement | Immigrants from South Central Asia | Dutch |
| Minimum | 5.2% | 14.8% |
| Maximum | 59.4% | 70.6% |
| Range | 54.2% | 55.8% |
| Mean | 34.9% | 36.8% |
| Median | 34.6% | 34.2% |
| Interquartile 25% (IQ1) | 28.1% | 30.6% |
| Interquartile 75% (IQ3) | 41.3% | 41.5% |
| Interquartile Range (IQR) | 13.2% | 11.0% |
| Standard Deviation (Sample) | 9.3% | 9.7% |
| Standard Deviation (Population) | 9.2% | 9.7% |
Demographics Similar to Immigrants from South Central Asia and Dutch by Wage/Income Gap
In terms of wage/income gap, the demographic groups most similar to Immigrants from South Central Asia are European (29.4%, a difference of 0.19%), Swedish (29.4%, a difference of 0.34%), Immigrants from Taiwan (29.5%, a difference of 0.46%), English (29.5%, a difference of 0.47%), and Czech (29.2%, a difference of 0.51%). Similarly, the demographic groups most similar to Dutch are Filipino (29.7%, a difference of 0.22%), Iranian (29.7%, a difference of 0.28%), English (29.5%, a difference of 0.58%), Immigrants from Taiwan (29.5%, a difference of 0.59%), and Swedish (29.4%, a difference of 0.72%).
| Demographics | Rating | Rank | Wage/Income Gap |
| Croatians | 0.0 /100 | #324 | Tragic 29.0% |
| Hungarians | 0.0 /100 | #325 | Tragic 29.0% |
| Immigrants | Belgium | 0.0 /100 | #326 | Tragic 29.0% |
| Immigrants | Iran | 0.0 /100 | #327 | Tragic 29.1% |
| Scandinavians | 0.0 /100 | #328 | Tragic 29.1% |
| Scottish | 0.0 /100 | #329 | Tragic 29.1% |
| Germans | 0.0 /100 | #330 | Tragic 29.2% |
| Czechs | 0.0 /100 | #331 | Tragic 29.2% |
| Immigrants | South Central Asia | 0.0 /100 | #332 | Tragic 29.3% |
| Europeans | 0.0 /100 | #333 | Tragic 29.4% |
| Swedes | 0.0 /100 | #334 | Tragic 29.4% |
| Immigrants | Taiwan | 0.0 /100 | #335 | Tragic 29.5% |
| English | 0.0 /100 | #336 | Tragic 29.5% |
| Dutch | 0.0 /100 | #337 | Tragic 29.6% |
| Filipinos | 0.0 /100 | #338 | Tragic 29.7% |
| Iranians | 0.0 /100 | #339 | Tragic 29.7% |
| Swiss | 0.0 /100 | #340 | Tragic 30.0% |
| Thais | 0.0 /100 | #341 | Tragic 30.5% |
| Pennsylvania Germans | 0.0 /100 | #342 | Tragic 30.7% |
| Danes | 0.0 /100 | #343 | Tragic 31.0% |
| Assyrians/Chaldeans/Syriacs | 0.0 /100 | #344 | Tragic 31.0% |