Panamanian vs Dutch Wage/Income Gap
COMPARE
Panamanian
Dutch
Wage/Income Gap
Wage/Income Gap Comparison
Panamanians
Dutch
24.4%
WAGE/INCOME GAP
96.5/ 100
METRIC RATING
114th/ 347
METRIC RANK
29.6%
WAGE/INCOME GAP
0.0/ 100
METRIC RATING
337th/ 347
METRIC RANK
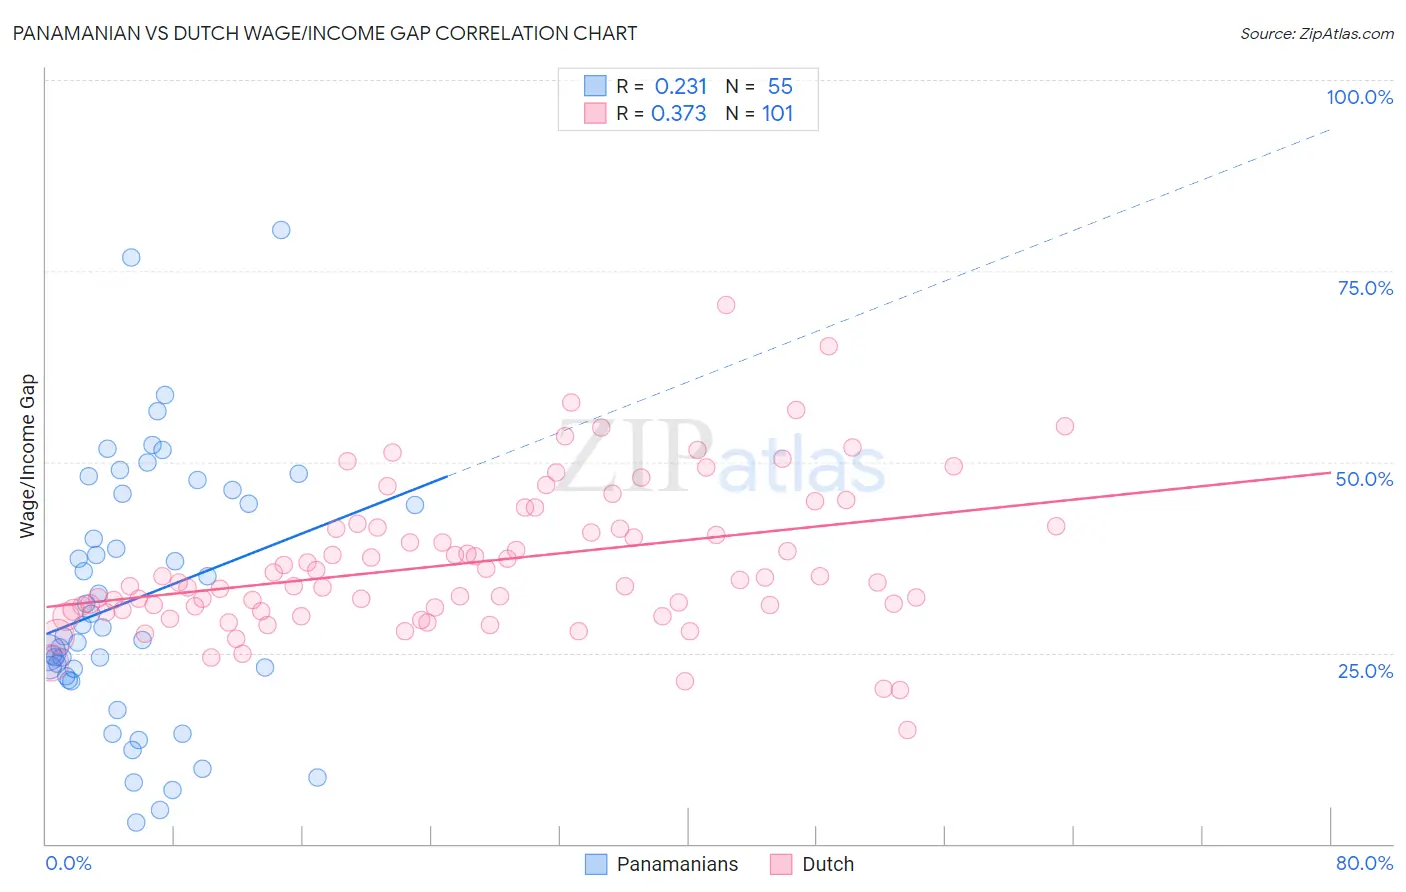
Panamanian vs Dutch Wage/Income Gap Correlation Chart
The statistical analysis conducted on geographies consisting of 281,143,702 people shows a weak positive correlation between the proportion of Panamanians and wage/income gap percentage in the United States with a correlation coefficient (R) of 0.231 and weighted average of 24.4%. Similarly, the statistical analysis conducted on geographies consisting of 552,244,152 people shows a mild positive correlation between the proportion of Dutch and wage/income gap percentage in the United States with a correlation coefficient (R) of 0.373 and weighted average of 29.6%, a difference of 21.6%.
Wage/Income Gap Correlation Summary
| Measurement | Panamanian | Dutch |
| Minimum | 2.8% | 14.8% |
| Maximum | 80.4% | 70.6% |
| Range | 77.6% | 55.8% |
| Mean | 32.1% | 36.8% |
| Median | 28.3% | 34.2% |
| Interquartile 25% (IQ1) | 22.0% | 30.6% |
| Interquartile 75% (IQ3) | 45.8% | 41.5% |
| Interquartile Range (IQR) | 23.8% | 11.0% |
| Standard Deviation (Sample) | 17.0% | 9.7% |
| Standard Deviation (Population) | 16.9% | 9.7% |
Similar Demographics by Wage/Income Gap
Demographics Similar to Panamanians by Wage/Income Gap
In terms of wage/income gap, the demographic groups most similar to Panamanians are Immigrants from Kenya (24.4%, a difference of 0.060%), Sioux (24.3%, a difference of 0.20%), Alaska Native (24.4%, a difference of 0.23%), Immigrants from Colombia (24.3%, a difference of 0.25%), and Immigrants from Afghanistan (24.4%, a difference of 0.29%).
| Demographics | Rating | Rank | Wage/Income Gap |
| Yaqui | 98.4 /100 | #107 | Exceptional 24.0% |
| Immigrants | Albania | 98.4 /100 | #108 | Exceptional 24.0% |
| Ugandans | 98.3 /100 | #109 | Exceptional 24.1% |
| Immigrants | Morocco | 98.1 /100 | #110 | Exceptional 24.1% |
| Soviet Union | 97.6 /100 | #111 | Exceptional 24.2% |
| Immigrants | Colombia | 97.0 /100 | #112 | Exceptional 24.3% |
| Sioux | 96.9 /100 | #113 | Exceptional 24.3% |
| Panamanians | 96.5 /100 | #114 | Exceptional 24.4% |
| Immigrants | Kenya | 96.4 /100 | #115 | Exceptional 24.4% |
| Alaska Natives | 96.0 /100 | #116 | Exceptional 24.4% |
| Immigrants | Afghanistan | 95.9 /100 | #117 | Exceptional 24.4% |
| Immigrants | Micronesia | 95.8 /100 | #118 | Exceptional 24.4% |
| Kenyans | 95.8 /100 | #119 | Exceptional 24.5% |
| Cree | 95.6 /100 | #120 | Exceptional 24.5% |
| Immigrants | Thailand | 94.9 /100 | #121 | Exceptional 24.5% |
Demographics Similar to Dutch by Wage/Income Gap
In terms of wage/income gap, the demographic groups most similar to Dutch are Filipino (29.7%, a difference of 0.22%), Iranian (29.7%, a difference of 0.28%), English (29.5%, a difference of 0.58%), Immigrants from Taiwan (29.5%, a difference of 0.59%), and Swedish (29.4%, a difference of 0.72%).
| Demographics | Rating | Rank | Wage/Income Gap |
| Germans | 0.0 /100 | #330 | Tragic 29.2% |
| Czechs | 0.0 /100 | #331 | Tragic 29.2% |
| Immigrants | South Central Asia | 0.0 /100 | #332 | Tragic 29.3% |
| Europeans | 0.0 /100 | #333 | Tragic 29.4% |
| Swedes | 0.0 /100 | #334 | Tragic 29.4% |
| Immigrants | Taiwan | 0.0 /100 | #335 | Tragic 29.5% |
| English | 0.0 /100 | #336 | Tragic 29.5% |
| Dutch | 0.0 /100 | #337 | Tragic 29.6% |
| Filipinos | 0.0 /100 | #338 | Tragic 29.7% |
| Iranians | 0.0 /100 | #339 | Tragic 29.7% |
| Swiss | 0.0 /100 | #340 | Tragic 30.0% |
| Thais | 0.0 /100 | #341 | Tragic 30.5% |
| Pennsylvania Germans | 0.0 /100 | #342 | Tragic 30.7% |
| Danes | 0.0 /100 | #343 | Tragic 31.0% |
| Assyrians/Chaldeans/Syriacs | 0.0 /100 | #344 | Tragic 31.0% |