Slavic vs Hmong Median Female Earnings
COMPARE
Slavic
Hmong
Median Female Earnings
Median Female Earnings Comparison
Slavs
Hmong
$39,613
MEDIAN FEMALE EARNINGS
45.6/ 100
METRIC RATING
178th/ 347
METRIC RANK
$35,498
MEDIAN FEMALE EARNINGS
0.0/ 100
METRIC RATING
297th/ 347
METRIC RANK
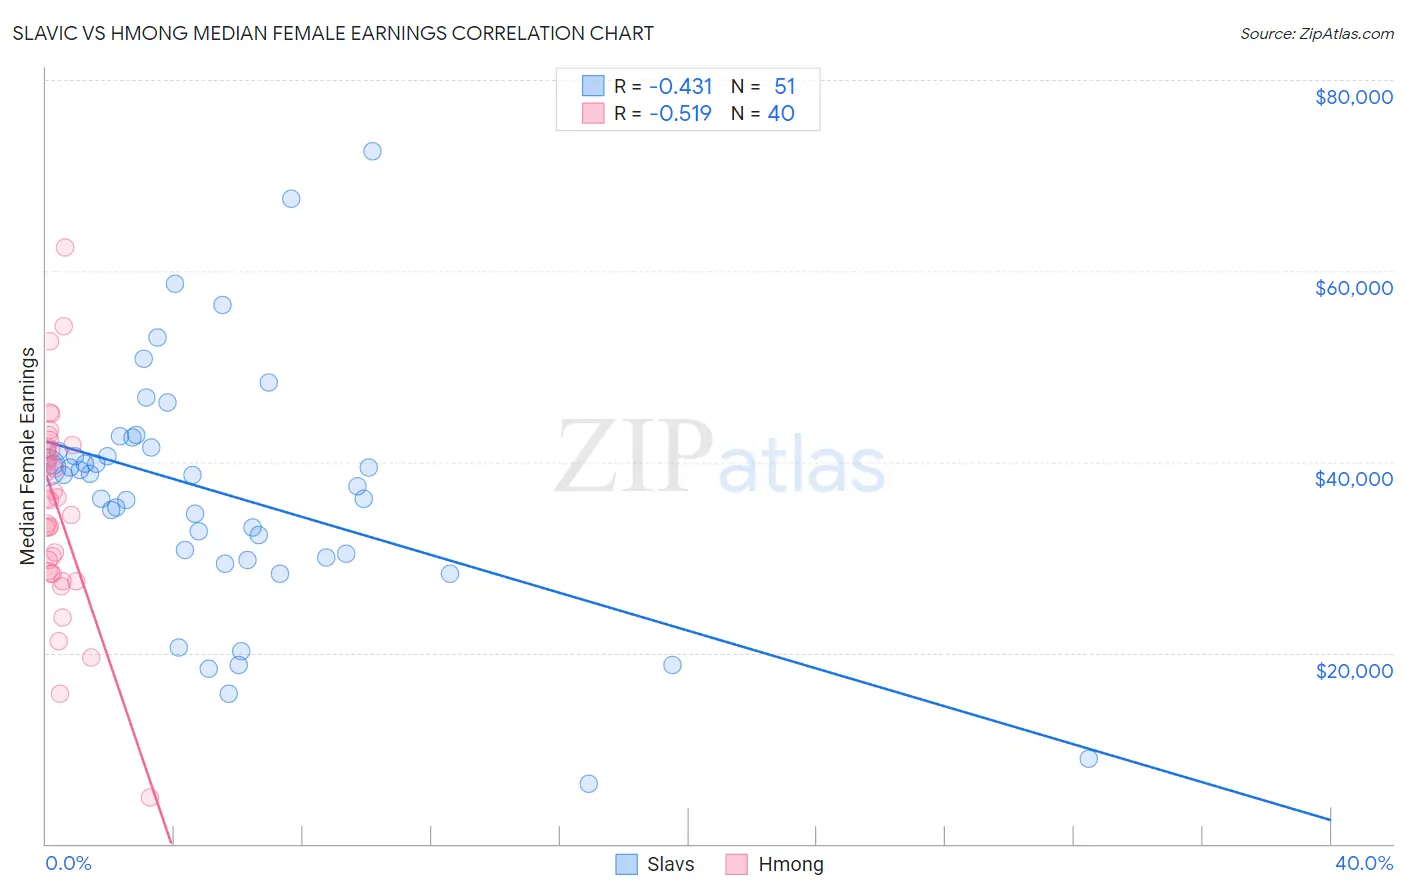
Slavic vs Hmong Median Female Earnings Correlation Chart
The statistical analysis conducted on geographies consisting of 270,801,270 people shows a moderate negative correlation between the proportion of Slavs and median female earnings in the United States with a correlation coefficient (R) of -0.431 and weighted average of $39,613. Similarly, the statistical analysis conducted on geographies consisting of 24,681,537 people shows a substantial negative correlation between the proportion of Hmong and median female earnings in the United States with a correlation coefficient (R) of -0.519 and weighted average of $35,498, a difference of 11.6%.
Median Female Earnings Correlation Summary
| Measurement | Slavic | Hmong |
| Minimum | $6,250 | $4,844 |
| Maximum | $72,578 | $62,438 |
| Range | $66,328 | $57,594 |
| Mean | $36,620 | $35,172 |
| Median | $38,590 | $36,091 |
| Interquartile 25% (IQ1) | $30,000 | $28,415 |
| Interquartile 75% (IQ3) | $41,444 | $41,366 |
| Interquartile Range (IQR) | $11,444 | $12,951 |
| Standard Deviation (Sample) | $12,835 | $10,537 |
| Standard Deviation (Population) | $12,708 | $10,404 |
Similar Demographics by Median Female Earnings
Demographics Similar to Slavs by Median Female Earnings
In terms of median female earnings, the demographic groups most similar to Slavs are Costa Rican ($39,622, a difference of 0.020%), Immigrants from Germany ($39,603, a difference of 0.030%), Nigerian ($39,641, a difference of 0.070%), Immigrants from South America ($39,643, a difference of 0.080%), and Immigrants from Kenya ($39,535, a difference of 0.20%).
| Demographics | Rating | Rank | Median Female Earnings |
| Immigrants | Portugal | 54.7 /100 | #171 | Average $39,788 |
| British | 53.8 /100 | #172 | Average $39,772 |
| Canadians | 51.4 /100 | #173 | Average $39,724 |
| South Americans | 50.0 /100 | #174 | Average $39,698 |
| Immigrants | South America | 47.2 /100 | #175 | Average $39,643 |
| Nigerians | 47.0 /100 | #176 | Average $39,641 |
| Costa Ricans | 46.1 /100 | #177 | Average $39,622 |
| Slavs | 45.6 /100 | #178 | Average $39,613 |
| Immigrants | Germany | 45.1 /100 | #179 | Average $39,603 |
| Immigrants | Kenya | 41.6 /100 | #180 | Average $39,535 |
| Tsimshian | 41.4 /100 | #181 | Average $39,530 |
| Tlingit-Haida | 40.5 /100 | #182 | Average $39,513 |
| Hungarians | 40.3 /100 | #183 | Average $39,510 |
| Europeans | 37.7 /100 | #184 | Fair $39,457 |
| Immigrants | West Indies | 36.9 /100 | #185 | Fair $39,441 |
Demographics Similar to Hmong by Median Female Earnings
In terms of median female earnings, the demographic groups most similar to Hmong are Immigrants from Micronesia ($35,477, a difference of 0.060%), Immigrants from Guatemala ($35,444, a difference of 0.15%), Yuman ($35,377, a difference of 0.34%), Mexican American Indian ($35,629, a difference of 0.37%), and Comanche ($35,661, a difference of 0.46%).
| Demographics | Rating | Rank | Median Female Earnings |
| Central American Indians | 0.0 /100 | #290 | Tragic $35,930 |
| Blackfeet | 0.0 /100 | #291 | Tragic $35,864 |
| Americans | 0.0 /100 | #292 | Tragic $35,777 |
| Guatemalans | 0.0 /100 | #293 | Tragic $35,695 |
| Cheyenne | 0.0 /100 | #294 | Tragic $35,673 |
| Comanche | 0.0 /100 | #295 | Tragic $35,661 |
| Mexican American Indians | 0.0 /100 | #296 | Tragic $35,629 |
| Hmong | 0.0 /100 | #297 | Tragic $35,498 |
| Immigrants | Micronesia | 0.0 /100 | #298 | Tragic $35,477 |
| Immigrants | Guatemala | 0.0 /100 | #299 | Tragic $35,444 |
| Yuman | 0.0 /100 | #300 | Tragic $35,377 |
| Pima | 0.0 /100 | #301 | Tragic $35,326 |
| Blacks/African Americans | 0.0 /100 | #302 | Tragic $35,315 |
| Immigrants | Latin America | 0.0 /100 | #303 | Tragic $35,307 |
| Crow | 0.0 /100 | #304 | Tragic $35,266 |