Slavic vs Ukrainian Median Female Earnings
COMPARE
Slavic
Ukrainian
Median Female Earnings
Median Female Earnings Comparison
Slavs
Ukrainians
$39,613
MEDIAN FEMALE EARNINGS
45.6/ 100
METRIC RATING
178th/ 347
METRIC RANK
$42,015
MEDIAN FEMALE EARNINGS
99.2/ 100
METRIC RATING
90th/ 347
METRIC RANK
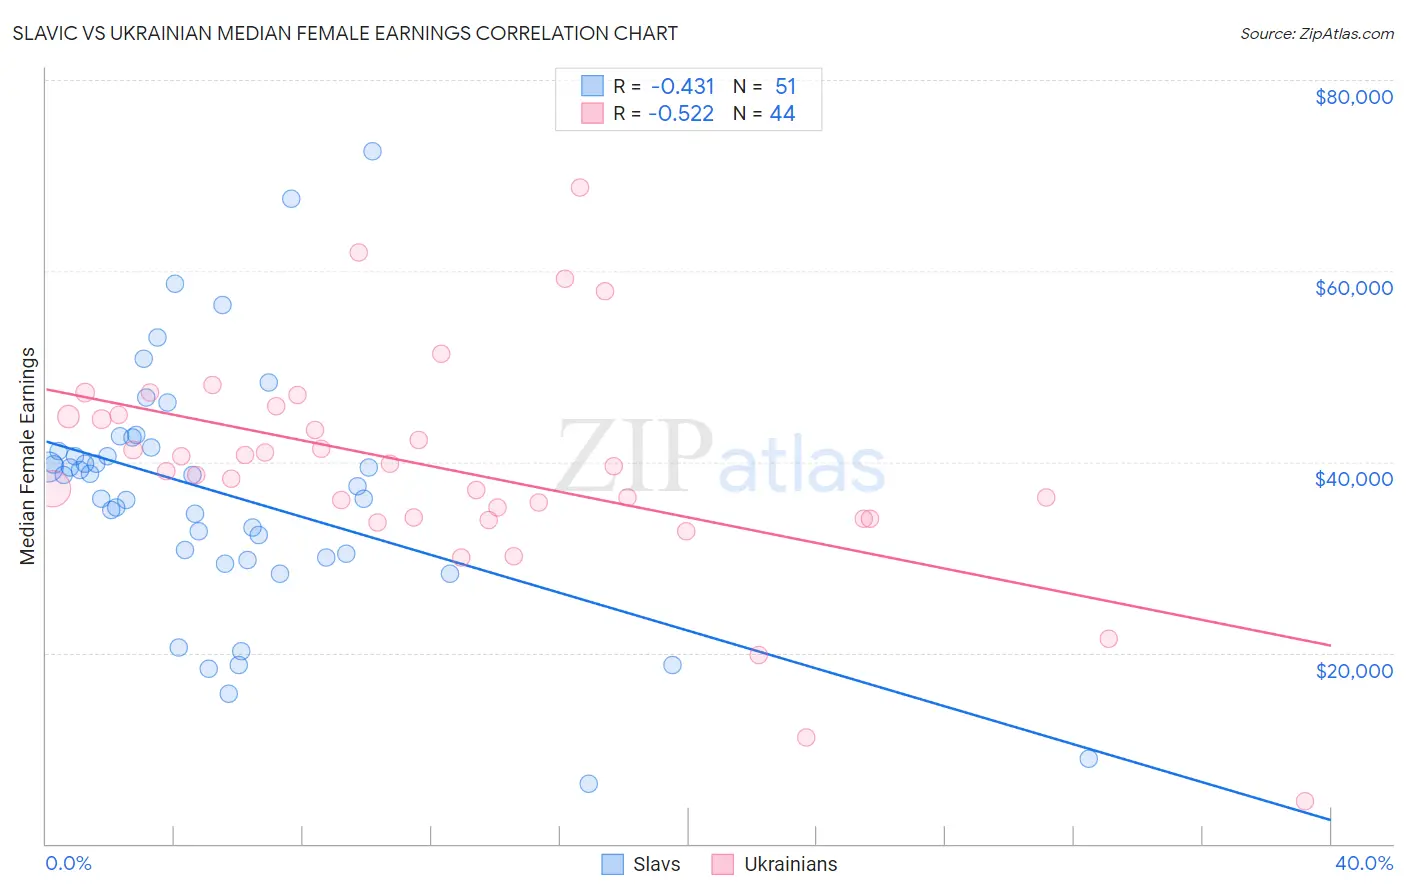
Slavic vs Ukrainian Median Female Earnings Correlation Chart
The statistical analysis conducted on geographies consisting of 270,801,270 people shows a moderate negative correlation between the proportion of Slavs and median female earnings in the United States with a correlation coefficient (R) of -0.431 and weighted average of $39,613. Similarly, the statistical analysis conducted on geographies consisting of 448,339,242 people shows a substantial negative correlation between the proportion of Ukrainians and median female earnings in the United States with a correlation coefficient (R) of -0.522 and weighted average of $42,015, a difference of 6.1%.
Median Female Earnings Correlation Summary
| Measurement | Slavic | Ukrainian |
| Minimum | $6,250 | $4,400 |
| Maximum | $72,578 | $68,750 |
| Range | $66,328 | $64,350 |
| Mean | $36,620 | $39,267 |
| Median | $38,590 | $39,270 |
| Interquartile 25% (IQ1) | $30,000 | $34,102 |
| Interquartile 75% (IQ3) | $41,444 | $44,856 |
| Interquartile Range (IQR) | $11,444 | $10,753 |
| Standard Deviation (Sample) | $12,835 | $11,661 |
| Standard Deviation (Population) | $12,708 | $11,527 |
Similar Demographics by Median Female Earnings
Demographics Similar to Slavs by Median Female Earnings
In terms of median female earnings, the demographic groups most similar to Slavs are Costa Rican ($39,622, a difference of 0.020%), Immigrants from Germany ($39,603, a difference of 0.030%), Nigerian ($39,641, a difference of 0.070%), Immigrants from South America ($39,643, a difference of 0.080%), and Immigrants from Kenya ($39,535, a difference of 0.20%).
| Demographics | Rating | Rank | Median Female Earnings |
| Immigrants | Portugal | 54.7 /100 | #171 | Average $39,788 |
| British | 53.8 /100 | #172 | Average $39,772 |
| Canadians | 51.4 /100 | #173 | Average $39,724 |
| South Americans | 50.0 /100 | #174 | Average $39,698 |
| Immigrants | South America | 47.2 /100 | #175 | Average $39,643 |
| Nigerians | 47.0 /100 | #176 | Average $39,641 |
| Costa Ricans | 46.1 /100 | #177 | Average $39,622 |
| Slavs | 45.6 /100 | #178 | Average $39,613 |
| Immigrants | Germany | 45.1 /100 | #179 | Average $39,603 |
| Immigrants | Kenya | 41.6 /100 | #180 | Average $39,535 |
| Tsimshian | 41.4 /100 | #181 | Average $39,530 |
| Tlingit-Haida | 40.5 /100 | #182 | Average $39,513 |
| Hungarians | 40.3 /100 | #183 | Average $39,510 |
| Europeans | 37.7 /100 | #184 | Fair $39,457 |
| Immigrants | West Indies | 36.9 /100 | #185 | Fair $39,441 |
Demographics Similar to Ukrainians by Median Female Earnings
In terms of median female earnings, the demographic groups most similar to Ukrainians are Immigrants from Western Europe ($41,990, a difference of 0.060%), Immigrants from Afghanistan ($42,055, a difference of 0.10%), Argentinean ($41,952, a difference of 0.15%), Immigrants from Northern Africa ($42,084, a difference of 0.16%), and Immigrants from Grenada ($41,932, a difference of 0.20%).
| Demographics | Rating | Rank | Median Female Earnings |
| Immigrants | Sierra Leone | 99.5 /100 | #83 | Exceptional $42,214 |
| Armenians | 99.5 /100 | #84 | Exceptional $42,212 |
| Laotians | 99.4 /100 | #85 | Exceptional $42,133 |
| Immigrants | St. Vincent and the Grenadines | 99.3 /100 | #86 | Exceptional $42,108 |
| Lithuanians | 99.3 /100 | #87 | Exceptional $42,108 |
| Immigrants | Northern Africa | 99.3 /100 | #88 | Exceptional $42,084 |
| Immigrants | Afghanistan | 99.3 /100 | #89 | Exceptional $42,055 |
| Ukrainians | 99.2 /100 | #90 | Exceptional $42,015 |
| Immigrants | Western Europe | 99.2 /100 | #91 | Exceptional $41,990 |
| Argentineans | 99.1 /100 | #92 | Exceptional $41,952 |
| Immigrants | Grenada | 99.0 /100 | #93 | Exceptional $41,932 |
| Moroccans | 98.9 /100 | #94 | Exceptional $41,872 |
| Immigrants | Netherlands | 98.9 /100 | #95 | Exceptional $41,870 |
| South Africans | 98.8 /100 | #96 | Exceptional $41,825 |
| Immigrants | Hungary | 98.8 /100 | #97 | Exceptional $41,820 |