Subsaharan African vs Hmong Median Female Earnings
COMPARE
Subsaharan African
Hmong
Median Female Earnings
Median Female Earnings Comparison
Sub-Saharan Africans
Hmong
$38,391
MEDIAN FEMALE EARNINGS
6.2/ 100
METRIC RATING
228th/ 347
METRIC RANK
$35,498
MEDIAN FEMALE EARNINGS
0.0/ 100
METRIC RATING
297th/ 347
METRIC RANK
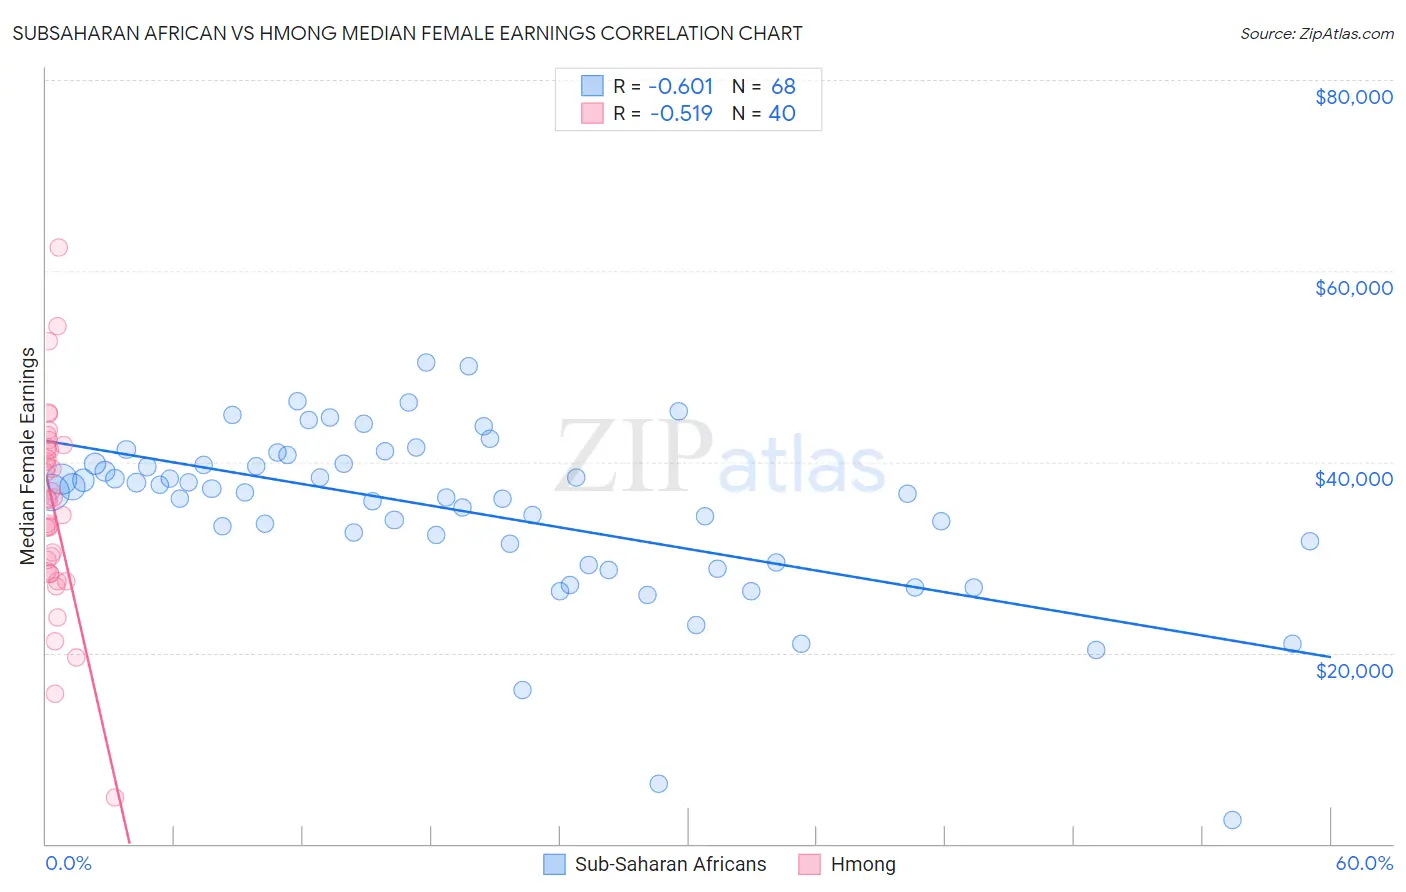
Subsaharan African vs Hmong Median Female Earnings Correlation Chart
The statistical analysis conducted on geographies consisting of 507,707,888 people shows a significant negative correlation between the proportion of Sub-Saharan Africans and median female earnings in the United States with a correlation coefficient (R) of -0.601 and weighted average of $38,391. Similarly, the statistical analysis conducted on geographies consisting of 24,681,537 people shows a substantial negative correlation between the proportion of Hmong and median female earnings in the United States with a correlation coefficient (R) of -0.519 and weighted average of $35,498, a difference of 8.2%.
Median Female Earnings Correlation Summary
| Measurement | Subsaharan African | Hmong |
| Minimum | $2,499 | $4,844 |
| Maximum | $50,416 | $62,438 |
| Range | $47,917 | $57,594 |
| Mean | $34,847 | $35,172 |
| Median | $36,829 | $36,091 |
| Interquartile 25% (IQ1) | $30,475 | $28,415 |
| Interquartile 75% (IQ3) | $39,811 | $41,366 |
| Interquartile Range (IQR) | $9,336 | $12,951 |
| Standard Deviation (Sample) | $8,928 | $10,537 |
| Standard Deviation (Population) | $8,863 | $10,404 |
Similar Demographics by Median Female Earnings
Demographics Similar to Sub-Saharan Africans by Median Female Earnings
In terms of median female earnings, the demographic groups most similar to Sub-Saharan Africans are Scottish ($38,397, a difference of 0.020%), Belgian ($38,382, a difference of 0.020%), Basque ($38,352, a difference of 0.10%), French Canadian ($38,436, a difference of 0.12%), and Somali ($38,333, a difference of 0.15%).
| Demographics | Rating | Rank | Median Female Earnings |
| Immigrants | Azores | 8.8 /100 | #221 | Tragic $38,573 |
| Japanese | 8.1 /100 | #222 | Tragic $38,528 |
| Immigrants | Sudan | 7.8 /100 | #223 | Tragic $38,511 |
| Native Hawaiians | 7.1 /100 | #224 | Tragic $38,461 |
| French | 7.0 /100 | #225 | Tragic $38,457 |
| French Canadians | 6.8 /100 | #226 | Tragic $38,436 |
| Scottish | 6.3 /100 | #227 | Tragic $38,397 |
| Sub-Saharan Africans | 6.2 /100 | #228 | Tragic $38,391 |
| Belgians | 6.1 /100 | #229 | Tragic $38,382 |
| Basques | 5.7 /100 | #230 | Tragic $38,352 |
| Somalis | 5.5 /100 | #231 | Tragic $38,333 |
| Scandinavians | 5.2 /100 | #232 | Tragic $38,306 |
| Tongans | 5.1 /100 | #233 | Tragic $38,288 |
| Celtics | 5.0 /100 | #234 | Tragic $38,283 |
| Sudanese | 4.4 /100 | #235 | Tragic $38,215 |
Demographics Similar to Hmong by Median Female Earnings
In terms of median female earnings, the demographic groups most similar to Hmong are Immigrants from Micronesia ($35,477, a difference of 0.060%), Immigrants from Guatemala ($35,444, a difference of 0.15%), Yuman ($35,377, a difference of 0.34%), Mexican American Indian ($35,629, a difference of 0.37%), and Comanche ($35,661, a difference of 0.46%).
| Demographics | Rating | Rank | Median Female Earnings |
| Central American Indians | 0.0 /100 | #290 | Tragic $35,930 |
| Blackfeet | 0.0 /100 | #291 | Tragic $35,864 |
| Americans | 0.0 /100 | #292 | Tragic $35,777 |
| Guatemalans | 0.0 /100 | #293 | Tragic $35,695 |
| Cheyenne | 0.0 /100 | #294 | Tragic $35,673 |
| Comanche | 0.0 /100 | #295 | Tragic $35,661 |
| Mexican American Indians | 0.0 /100 | #296 | Tragic $35,629 |
| Hmong | 0.0 /100 | #297 | Tragic $35,498 |
| Immigrants | Micronesia | 0.0 /100 | #298 | Tragic $35,477 |
| Immigrants | Guatemala | 0.0 /100 | #299 | Tragic $35,444 |
| Yuman | 0.0 /100 | #300 | Tragic $35,377 |
| Pima | 0.0 /100 | #301 | Tragic $35,326 |
| Blacks/African Americans | 0.0 /100 | #302 | Tragic $35,315 |
| Immigrants | Latin America | 0.0 /100 | #303 | Tragic $35,307 |
| Crow | 0.0 /100 | #304 | Tragic $35,266 |