Slavic vs Hmong In Labor Force | Age 16-19
COMPARE
Slavic
Hmong
In Labor Force | Age 16-19
In Labor Force | Age 16-19 Comparison
Slavs
Hmong
40.4%
IN LABOR FORCE | AGE 16-19
100.0/ 100
METRIC RATING
59th/ 347
METRIC RANK
38.7%
IN LABOR FORCE | AGE 16-19
99.1/ 100
METRIC RATING
101st/ 347
METRIC RANK
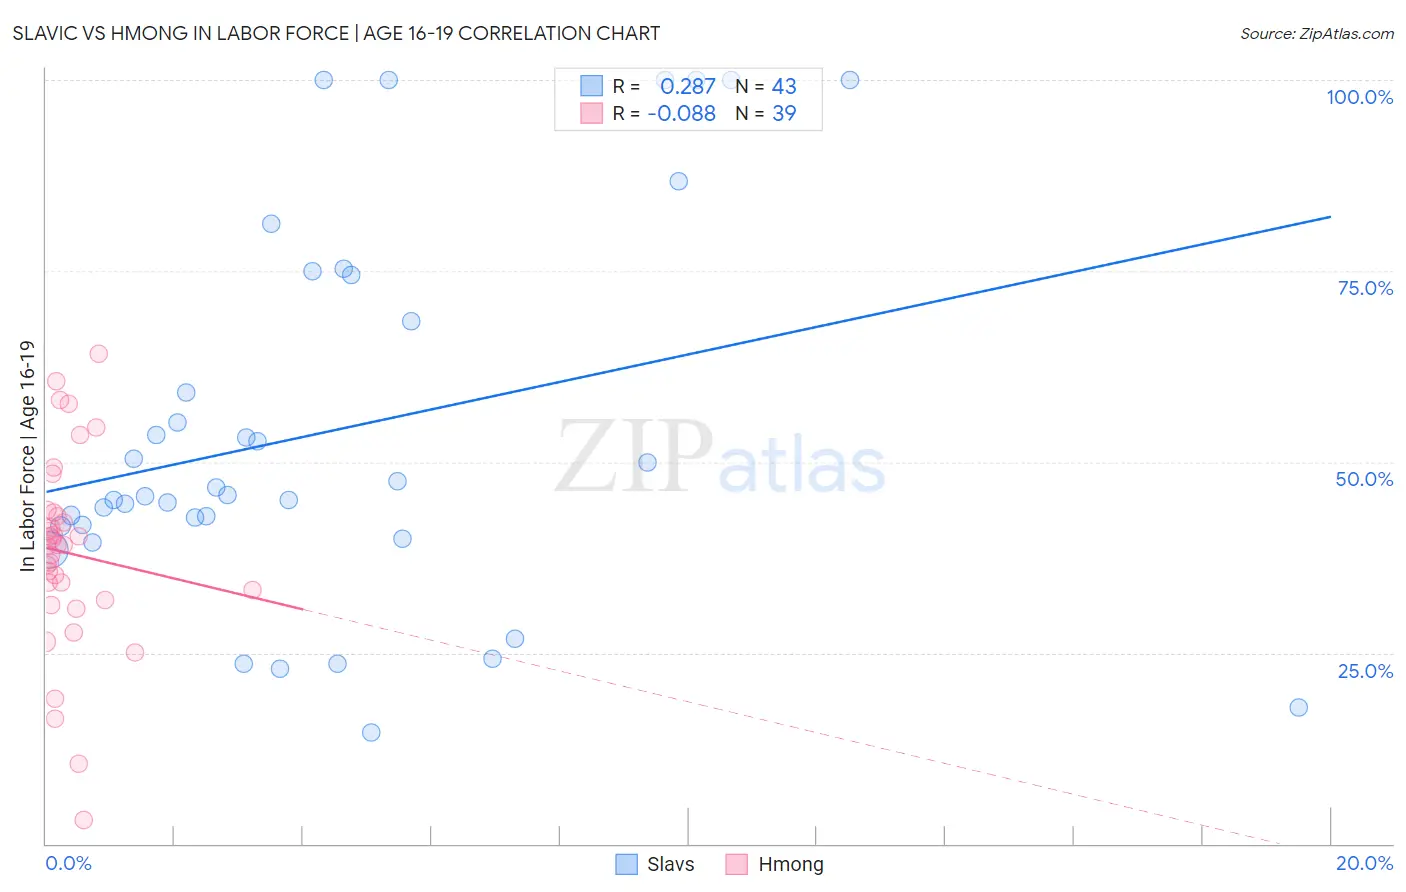
Slavic vs Hmong In Labor Force | Age 16-19 Correlation Chart
The statistical analysis conducted on geographies consisting of 270,628,141 people shows a weak positive correlation between the proportion of Slavs and labor force participation rate among population between the ages 16 and 19 in the United States with a correlation coefficient (R) of 0.287 and weighted average of 40.4%. Similarly, the statistical analysis conducted on geographies consisting of 24,681,034 people shows a slight negative correlation between the proportion of Hmong and labor force participation rate among population between the ages 16 and 19 in the United States with a correlation coefficient (R) of -0.088 and weighted average of 38.7%, a difference of 4.3%.
In Labor Force | Age 16-19 Correlation Summary
| Measurement | Slavic | Hmong |
| Minimum | 14.6% | 3.1% |
| Maximum | 100.0% | 64.2% |
| Range | 85.4% | 61.1% |
| Mean | 54.1% | 38.1% |
| Median | 45.6% | 39.1% |
| Interquartile 25% (IQ1) | 41.6% | 31.9% |
| Interquartile 75% (IQ3) | 74.5% | 43.4% |
| Interquartile Range (IQR) | 32.9% | 11.5% |
| Standard Deviation (Sample) | 24.6% | 12.9% |
| Standard Deviation (Population) | 24.3% | 12.7% |
Similar Demographics by In Labor Force | Age 16-19
Demographics Similar to Slavs by In Labor Force | Age 16-19
In terms of in labor force | age 16-19, the demographic groups most similar to Slavs are Immigrants from Eastern Africa (40.4%, a difference of 0.040%), Aleut (40.4%, a difference of 0.13%), Lithuanian (40.4%, a difference of 0.15%), Fijian (40.4%, a difference of 0.17%), and American (40.3%, a difference of 0.19%).
| Demographics | Rating | Rank | In Labor Force | Age 16-19 |
| Immigrants | Laos | 100.0 /100 | #52 | Exceptional 40.6% |
| Immigrants | Kenya | 100.0 /100 | #53 | Exceptional 40.5% |
| Tlingit-Haida | 100.0 /100 | #54 | Exceptional 40.5% |
| British | 100.0 /100 | #55 | Exceptional 40.5% |
| Fijians | 100.0 /100 | #56 | Exceptional 40.4% |
| Lithuanians | 100.0 /100 | #57 | Exceptional 40.4% |
| Aleuts | 100.0 /100 | #58 | Exceptional 40.4% |
| Slavs | 100.0 /100 | #59 | Exceptional 40.4% |
| Immigrants | Eastern Africa | 100.0 /100 | #60 | Exceptional 40.4% |
| Americans | 100.0 /100 | #61 | Exceptional 40.3% |
| Cherokee | 100.0 /100 | #62 | Exceptional 40.2% |
| Northern Europeans | 100.0 /100 | #63 | Exceptional 40.2% |
| Immigrants | Micronesia | 100.0 /100 | #64 | Exceptional 40.2% |
| Kenyans | 100.0 /100 | #65 | Exceptional 40.1% |
| Immigrants | Nonimmigrants | 100.0 /100 | #66 | Exceptional 40.1% |
Demographics Similar to Hmong by In Labor Force | Age 16-19
In terms of in labor force | age 16-19, the demographic groups most similar to Hmong are Zimbabwean (38.7%, a difference of 0.010%), Immigrants from Cameroon (38.7%, a difference of 0.040%), Immigrants from Thailand (38.7%, a difference of 0.070%), Immigrants from Eritrea (38.7%, a difference of 0.090%), and Iraqi (38.6%, a difference of 0.25%).
| Demographics | Rating | Rank | In Labor Force | Age 16-19 |
| Immigrants | Canada | 99.4 /100 | #94 | Exceptional 38.9% |
| Immigrants | North America | 99.4 /100 | #95 | Exceptional 38.9% |
| Latvians | 99.4 /100 | #96 | Exceptional 38.9% |
| Greeks | 99.3 /100 | #97 | Exceptional 38.9% |
| Ugandans | 99.3 /100 | #98 | Exceptional 38.9% |
| Immigrants | North Macedonia | 99.3 /100 | #99 | Exceptional 38.9% |
| Immigrants | Thailand | 99.1 /100 | #100 | Exceptional 38.7% |
| Hmong | 99.1 /100 | #101 | Exceptional 38.7% |
| Zimbabweans | 99.1 /100 | #102 | Exceptional 38.7% |
| Immigrants | Cameroon | 99.0 /100 | #103 | Exceptional 38.7% |
| Immigrants | Eritrea | 99.0 /100 | #104 | Exceptional 38.7% |
| Iraqis | 98.9 /100 | #105 | Exceptional 38.6% |
| Delaware | 98.8 /100 | #106 | Exceptional 38.6% |
| Chinese | 98.8 /100 | #107 | Exceptional 38.6% |
| Immigrants | Ethiopia | 98.7 /100 | #108 | Exceptional 38.6% |