Turkish vs Hmong Median Female Earnings
COMPARE
Turkish
Hmong
Median Female Earnings
Median Female Earnings Comparison
Turks
Hmong
$44,695
MEDIAN FEMALE EARNINGS
100.0/ 100
METRIC RATING
27th/ 347
METRIC RANK
$35,498
MEDIAN FEMALE EARNINGS
0.0/ 100
METRIC RATING
297th/ 347
METRIC RANK
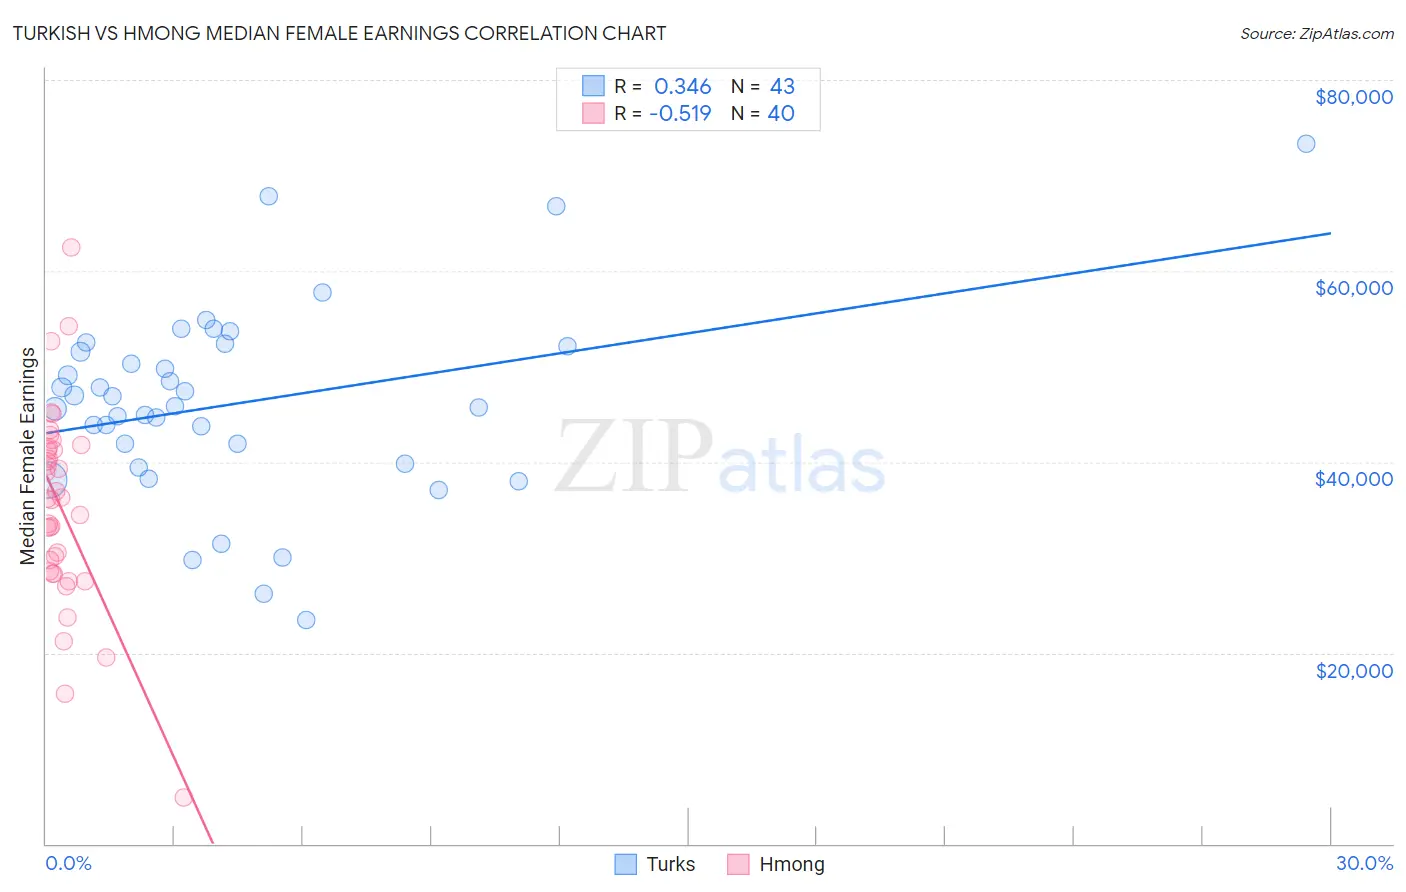
Turkish vs Hmong Median Female Earnings Correlation Chart
The statistical analysis conducted on geographies consisting of 271,816,857 people shows a mild positive correlation between the proportion of Turks and median female earnings in the United States with a correlation coefficient (R) of 0.346 and weighted average of $44,695. Similarly, the statistical analysis conducted on geographies consisting of 24,681,537 people shows a substantial negative correlation between the proportion of Hmong and median female earnings in the United States with a correlation coefficient (R) of -0.519 and weighted average of $35,498, a difference of 25.9%.
Median Female Earnings Correlation Summary
| Measurement | Turkish | Hmong |
| Minimum | $23,409 | $4,844 |
| Maximum | $73,333 | $62,438 |
| Range | $49,924 | $57,594 |
| Mean | $46,115 | $35,172 |
| Median | $45,875 | $36,091 |
| Interquartile 25% (IQ1) | $39,746 | $28,415 |
| Interquartile 75% (IQ3) | $52,083 | $41,366 |
| Interquartile Range (IQR) | $12,337 | $12,951 |
| Standard Deviation (Sample) | $10,119 | $10,537 |
| Standard Deviation (Population) | $10,000 | $10,404 |
Similar Demographics by Median Female Earnings
Demographics Similar to Turks by Median Female Earnings
In terms of median female earnings, the demographic groups most similar to Turks are Immigrants from Russia ($44,680, a difference of 0.030%), Immigrants from Belarus ($44,757, a difference of 0.14%), Immigrants from Sweden ($44,774, a difference of 0.18%), Immigrants from Belgium ($44,587, a difference of 0.24%), and Asian ($44,586, a difference of 0.24%).
| Demographics | Rating | Rank | Median Female Earnings |
| Immigrants | Japan | 100.0 /100 | #20 | Exceptional $45,323 |
| Cambodians | 100.0 /100 | #21 | Exceptional $45,014 |
| Immigrants | Greece | 100.0 /100 | #22 | Exceptional $44,976 |
| Burmese | 100.0 /100 | #23 | Exceptional $44,911 |
| Immigrants | Korea | 100.0 /100 | #24 | Exceptional $44,847 |
| Immigrants | Sweden | 100.0 /100 | #25 | Exceptional $44,774 |
| Immigrants | Belarus | 100.0 /100 | #26 | Exceptional $44,757 |
| Turks | 100.0 /100 | #27 | Exceptional $44,695 |
| Immigrants | Russia | 100.0 /100 | #28 | Exceptional $44,680 |
| Immigrants | Belgium | 100.0 /100 | #29 | Exceptional $44,587 |
| Asians | 100.0 /100 | #30 | Exceptional $44,586 |
| Immigrants | France | 100.0 /100 | #31 | Exceptional $44,541 |
| Immigrants | Northern Europe | 100.0 /100 | #32 | Exceptional $44,366 |
| Immigrants | Asia | 100.0 /100 | #33 | Exceptional $44,198 |
| Russians | 100.0 /100 | #34 | Exceptional $44,169 |
Demographics Similar to Hmong by Median Female Earnings
In terms of median female earnings, the demographic groups most similar to Hmong are Immigrants from Micronesia ($35,477, a difference of 0.060%), Immigrants from Guatemala ($35,444, a difference of 0.15%), Yuman ($35,377, a difference of 0.34%), Mexican American Indian ($35,629, a difference of 0.37%), and Comanche ($35,661, a difference of 0.46%).
| Demographics | Rating | Rank | Median Female Earnings |
| Central American Indians | 0.0 /100 | #290 | Tragic $35,930 |
| Blackfeet | 0.0 /100 | #291 | Tragic $35,864 |
| Americans | 0.0 /100 | #292 | Tragic $35,777 |
| Guatemalans | 0.0 /100 | #293 | Tragic $35,695 |
| Cheyenne | 0.0 /100 | #294 | Tragic $35,673 |
| Comanche | 0.0 /100 | #295 | Tragic $35,661 |
| Mexican American Indians | 0.0 /100 | #296 | Tragic $35,629 |
| Hmong | 0.0 /100 | #297 | Tragic $35,498 |
| Immigrants | Micronesia | 0.0 /100 | #298 | Tragic $35,477 |
| Immigrants | Guatemala | 0.0 /100 | #299 | Tragic $35,444 |
| Yuman | 0.0 /100 | #300 | Tragic $35,377 |
| Pima | 0.0 /100 | #301 | Tragic $35,326 |
| Blacks/African Americans | 0.0 /100 | #302 | Tragic $35,315 |
| Immigrants | Latin America | 0.0 /100 | #303 | Tragic $35,307 |
| Crow | 0.0 /100 | #304 | Tragic $35,266 |