Slavic vs Immigrants from Brazil Median Female Earnings
COMPARE
Slavic
Immigrants from Brazil
Median Female Earnings
Median Female Earnings Comparison
Slavs
Immigrants from Brazil
$39,613
MEDIAN FEMALE EARNINGS
45.6/ 100
METRIC RATING
178th/ 347
METRIC RANK
$41,273
MEDIAN FEMALE EARNINGS
96.4/ 100
METRIC RATING
116th/ 347
METRIC RANK
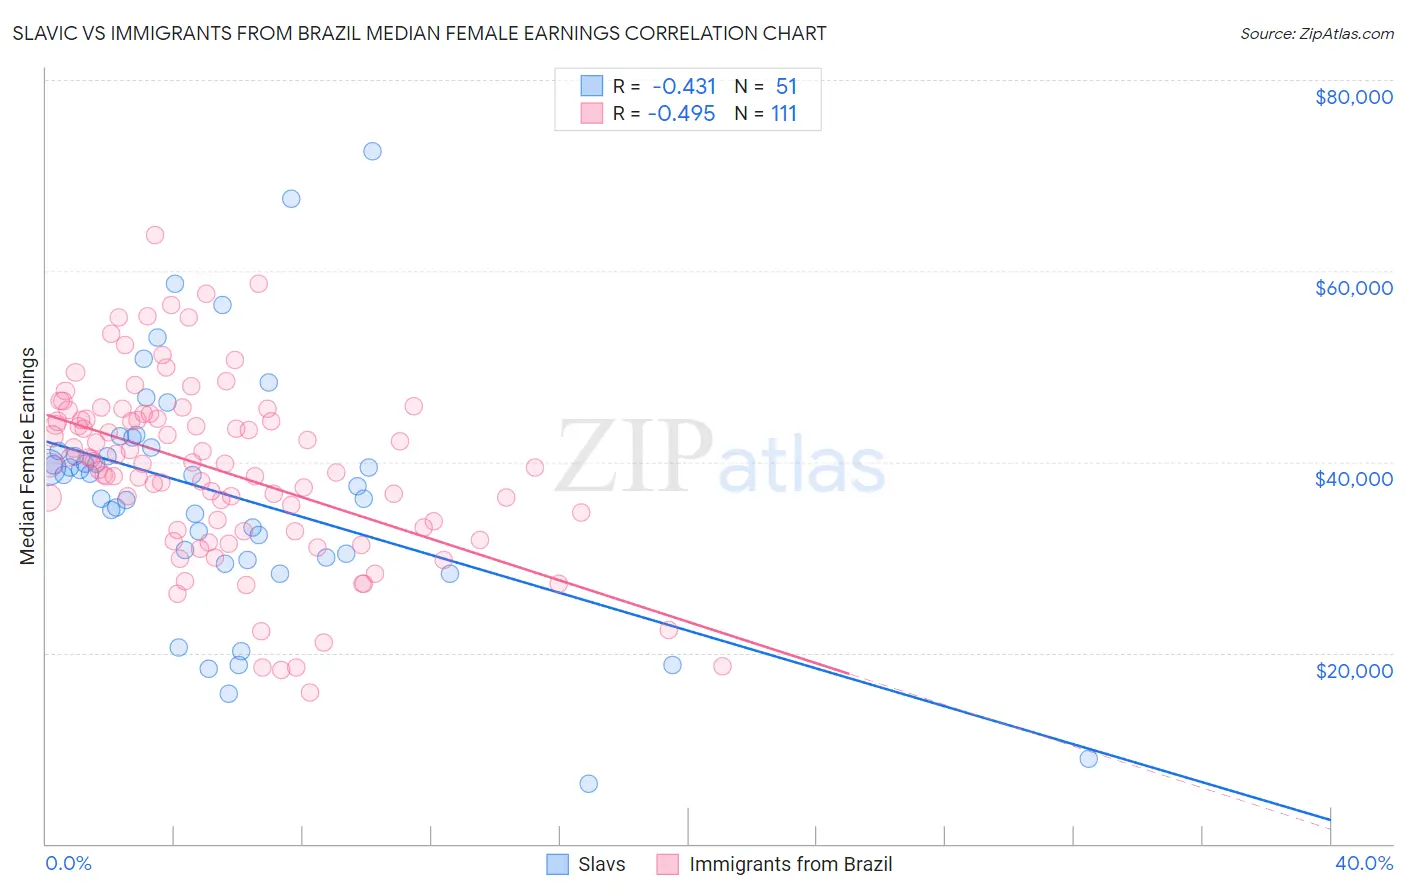
Slavic vs Immigrants from Brazil Median Female Earnings Correlation Chart
The statistical analysis conducted on geographies consisting of 270,801,270 people shows a moderate negative correlation between the proportion of Slavs and median female earnings in the United States with a correlation coefficient (R) of -0.431 and weighted average of $39,613. Similarly, the statistical analysis conducted on geographies consisting of 342,933,963 people shows a moderate negative correlation between the proportion of Immigrants from Brazil and median female earnings in the United States with a correlation coefficient (R) of -0.495 and weighted average of $41,273, a difference of 4.2%.
Median Female Earnings Correlation Summary
| Measurement | Slavic | Immigrants from Brazil |
| Minimum | $6,250 | $15,833 |
| Maximum | $72,578 | $63,747 |
| Range | $66,328 | $47,914 |
| Mean | $36,620 | $39,161 |
| Median | $38,590 | $39,865 |
| Interquartile 25% (IQ1) | $30,000 | $32,810 |
| Interquartile 75% (IQ3) | $41,444 | $44,568 |
| Interquartile Range (IQR) | $11,444 | $11,758 |
| Standard Deviation (Sample) | $12,835 | $9,325 |
| Standard Deviation (Population) | $12,708 | $9,283 |
Similar Demographics by Median Female Earnings
Demographics Similar to Slavs by Median Female Earnings
In terms of median female earnings, the demographic groups most similar to Slavs are Costa Rican ($39,622, a difference of 0.020%), Immigrants from Germany ($39,603, a difference of 0.030%), Nigerian ($39,641, a difference of 0.070%), Immigrants from South America ($39,643, a difference of 0.080%), and Immigrants from Kenya ($39,535, a difference of 0.20%).
| Demographics | Rating | Rank | Median Female Earnings |
| Immigrants | Portugal | 54.7 /100 | #171 | Average $39,788 |
| British | 53.8 /100 | #172 | Average $39,772 |
| Canadians | 51.4 /100 | #173 | Average $39,724 |
| South Americans | 50.0 /100 | #174 | Average $39,698 |
| Immigrants | South America | 47.2 /100 | #175 | Average $39,643 |
| Nigerians | 47.0 /100 | #176 | Average $39,641 |
| Costa Ricans | 46.1 /100 | #177 | Average $39,622 |
| Slavs | 45.6 /100 | #178 | Average $39,613 |
| Immigrants | Germany | 45.1 /100 | #179 | Average $39,603 |
| Immigrants | Kenya | 41.6 /100 | #180 | Average $39,535 |
| Tsimshian | 41.4 /100 | #181 | Average $39,530 |
| Tlingit-Haida | 40.5 /100 | #182 | Average $39,513 |
| Hungarians | 40.3 /100 | #183 | Average $39,510 |
| Europeans | 37.7 /100 | #184 | Fair $39,457 |
| Immigrants | West Indies | 36.9 /100 | #185 | Fair $39,441 |
Demographics Similar to Immigrants from Brazil by Median Female Earnings
In terms of median female earnings, the demographic groups most similar to Immigrants from Brazil are Immigrants from England ($41,277, a difference of 0.010%), Korean ($41,276, a difference of 0.010%), Macedonian ($41,286, a difference of 0.030%), Barbadian ($41,261, a difference of 0.030%), and Immigrants from North America ($41,319, a difference of 0.11%).
| Demographics | Rating | Rank | Median Female Earnings |
| Chinese | 97.5 /100 | #109 | Exceptional $41,461 |
| Immigrants | Western Asia | 97.0 /100 | #110 | Exceptional $41,375 |
| Immigrants | Canada | 97.0 /100 | #111 | Exceptional $41,373 |
| Immigrants | North America | 96.7 /100 | #112 | Exceptional $41,319 |
| Macedonians | 96.4 /100 | #113 | Exceptional $41,286 |
| Immigrants | England | 96.4 /100 | #114 | Exceptional $41,277 |
| Koreans | 96.4 /100 | #115 | Exceptional $41,276 |
| Immigrants | Brazil | 96.4 /100 | #116 | Exceptional $41,273 |
| Barbadians | 96.3 /100 | #117 | Exceptional $41,261 |
| Immigrants | Lebanon | 95.6 /100 | #118 | Exceptional $41,183 |
| Immigrants | Philippines | 95.0 /100 | #119 | Exceptional $41,114 |
| Immigrants | Kuwait | 94.4 /100 | #120 | Exceptional $41,055 |
| Croatians | 93.7 /100 | #121 | Exceptional $40,993 |
| Immigrants | Jordan | 93.5 /100 | #122 | Exceptional $40,977 |
| Guyanese | 93.4 /100 | #123 | Exceptional $40,973 |