Slavic vs Immigrants from Venezuela Median Female Earnings
COMPARE
Slavic
Immigrants from Venezuela
Median Female Earnings
Median Female Earnings Comparison
Slavs
Immigrants from Venezuela
$39,613
MEDIAN FEMALE EARNINGS
45.6/ 100
METRIC RATING
178th/ 347
METRIC RANK
$37,003
MEDIAN FEMALE EARNINGS
0.4/ 100
METRIC RATING
269th/ 347
METRIC RANK
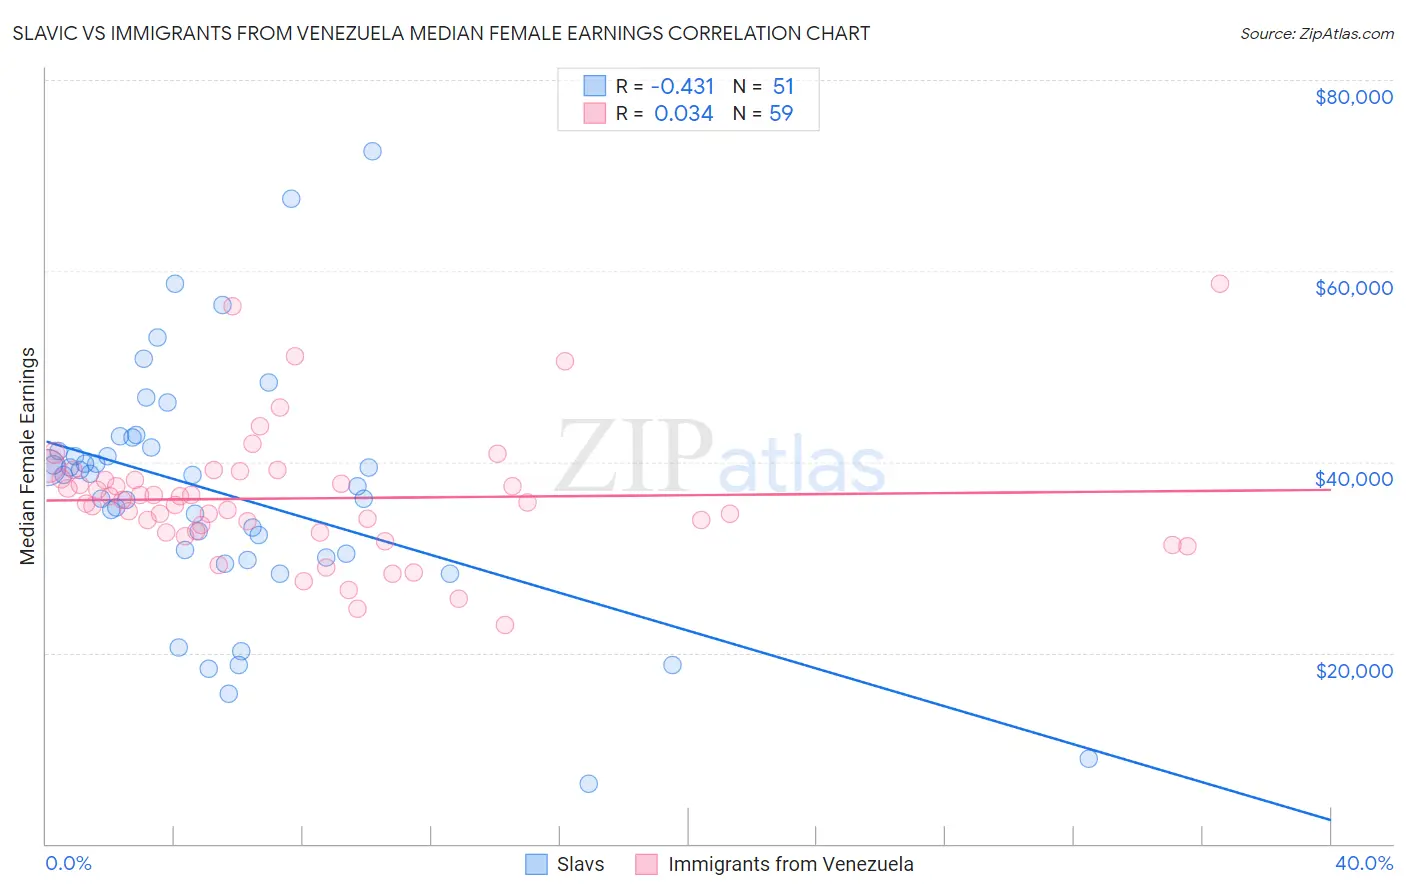
Slavic vs Immigrants from Venezuela Median Female Earnings Correlation Chart
The statistical analysis conducted on geographies consisting of 270,801,270 people shows a moderate negative correlation between the proportion of Slavs and median female earnings in the United States with a correlation coefficient (R) of -0.431 and weighted average of $39,613. Similarly, the statistical analysis conducted on geographies consisting of 287,813,755 people shows no correlation between the proportion of Immigrants from Venezuela and median female earnings in the United States with a correlation coefficient (R) of 0.034 and weighted average of $37,003, a difference of 7.0%.
Median Female Earnings Correlation Summary
| Measurement | Slavic | Immigrants from Venezuela |
| Minimum | $6,250 | $22,864 |
| Maximum | $72,578 | $58,709 |
| Range | $66,328 | $35,845 |
| Mean | $36,620 | $36,176 |
| Median | $38,590 | $35,750 |
| Interquartile 25% (IQ1) | $30,000 | $32,617 |
| Interquartile 75% (IQ3) | $41,444 | $38,204 |
| Interquartile Range (IQR) | $11,444 | $5,588 |
| Standard Deviation (Sample) | $12,835 | $6,703 |
| Standard Deviation (Population) | $12,708 | $6,646 |
Similar Demographics by Median Female Earnings
Demographics Similar to Slavs by Median Female Earnings
In terms of median female earnings, the demographic groups most similar to Slavs are Costa Rican ($39,622, a difference of 0.020%), Immigrants from Germany ($39,603, a difference of 0.030%), Nigerian ($39,641, a difference of 0.070%), Immigrants from South America ($39,643, a difference of 0.080%), and Immigrants from Kenya ($39,535, a difference of 0.20%).
| Demographics | Rating | Rank | Median Female Earnings |
| Immigrants | Portugal | 54.7 /100 | #171 | Average $39,788 |
| British | 53.8 /100 | #172 | Average $39,772 |
| Canadians | 51.4 /100 | #173 | Average $39,724 |
| South Americans | 50.0 /100 | #174 | Average $39,698 |
| Immigrants | South America | 47.2 /100 | #175 | Average $39,643 |
| Nigerians | 47.0 /100 | #176 | Average $39,641 |
| Costa Ricans | 46.1 /100 | #177 | Average $39,622 |
| Slavs | 45.6 /100 | #178 | Average $39,613 |
| Immigrants | Germany | 45.1 /100 | #179 | Average $39,603 |
| Immigrants | Kenya | 41.6 /100 | #180 | Average $39,535 |
| Tsimshian | 41.4 /100 | #181 | Average $39,530 |
| Tlingit-Haida | 40.5 /100 | #182 | Average $39,513 |
| Hungarians | 40.3 /100 | #183 | Average $39,510 |
| Europeans | 37.7 /100 | #184 | Fair $39,457 |
| Immigrants | West Indies | 36.9 /100 | #185 | Fair $39,441 |
Demographics Similar to Immigrants from Venezuela by Median Female Earnings
In terms of median female earnings, the demographic groups most similar to Immigrants from Venezuela are Cree ($37,018, a difference of 0.040%), Nonimmigrants ($37,024, a difference of 0.060%), Dominican ($37,046, a difference of 0.12%), Immigrants from Belize ($37,056, a difference of 0.14%), and Salvadoran ($37,083, a difference of 0.22%).
| Demographics | Rating | Rank | Median Female Earnings |
| Venezuelans | 0.7 /100 | #262 | Tragic $37,282 |
| German Russians | 0.5 /100 | #263 | Tragic $37,105 |
| Salvadorans | 0.4 /100 | #264 | Tragic $37,083 |
| Immigrants | Belize | 0.4 /100 | #265 | Tragic $37,056 |
| Dominicans | 0.4 /100 | #266 | Tragic $37,046 |
| Immigrants | Nonimmigrants | 0.4 /100 | #267 | Tragic $37,024 |
| Cree | 0.4 /100 | #268 | Tragic $37,018 |
| Immigrants | Venezuela | 0.4 /100 | #269 | Tragic $37,003 |
| French American Indians | 0.3 /100 | #270 | Tragic $36,920 |
| Nicaraguans | 0.3 /100 | #271 | Tragic $36,904 |
| Immigrants | Dominican Republic | 0.3 /100 | #272 | Tragic $36,857 |
| Immigrants | Laos | 0.3 /100 | #273 | Tragic $36,841 |
| Immigrants | El Salvador | 0.2 /100 | #274 | Tragic $36,673 |
| Africans | 0.1 /100 | #275 | Tragic $36,530 |
| Central Americans | 0.1 /100 | #276 | Tragic $36,492 |