Slavic vs Immigrants from Costa Rica Median Female Earnings
COMPARE
Slavic
Immigrants from Costa Rica
Median Female Earnings
Median Female Earnings Comparison
Slavs
Immigrants from Costa Rica
$39,613
MEDIAN FEMALE EARNINGS
45.6/ 100
METRIC RATING
178th/ 347
METRIC RANK
$39,186
MEDIAN FEMALE EARNINGS
25.6/ 100
METRIC RATING
196th/ 347
METRIC RANK
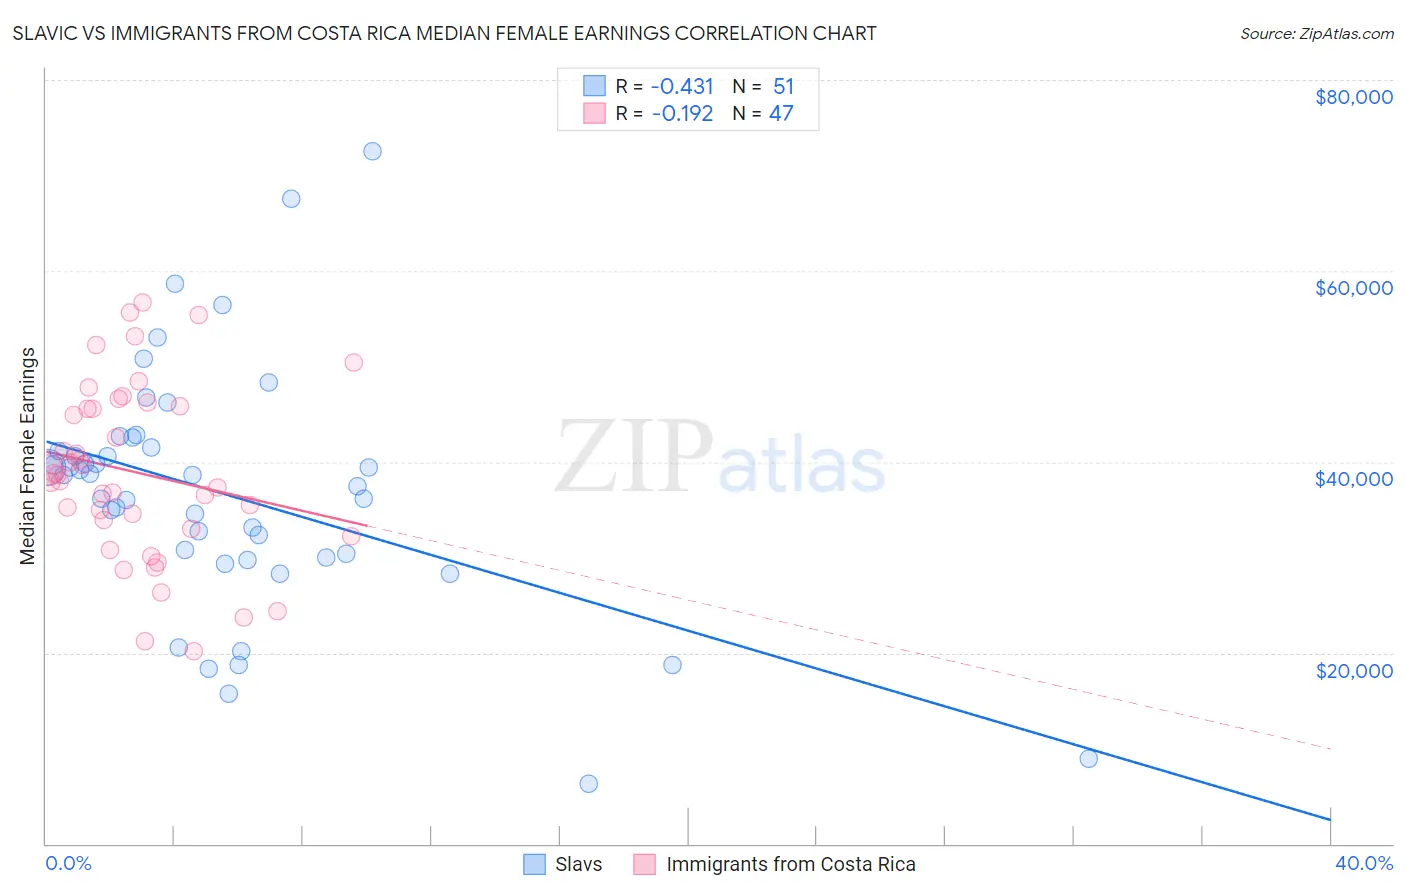
Slavic vs Immigrants from Costa Rica Median Female Earnings Correlation Chart
The statistical analysis conducted on geographies consisting of 270,801,270 people shows a moderate negative correlation between the proportion of Slavs and median female earnings in the United States with a correlation coefficient (R) of -0.431 and weighted average of $39,613. Similarly, the statistical analysis conducted on geographies consisting of 204,263,663 people shows a poor negative correlation between the proportion of Immigrants from Costa Rica and median female earnings in the United States with a correlation coefficient (R) of -0.192 and weighted average of $39,186, a difference of 1.1%.
Median Female Earnings Correlation Summary
| Measurement | Slavic | Immigrants from Costa Rica |
| Minimum | $6,250 | $20,158 |
| Maximum | $72,578 | $56,684 |
| Range | $66,328 | $36,526 |
| Mean | $36,620 | $38,901 |
| Median | $38,590 | $38,633 |
| Interquartile 25% (IQ1) | $30,000 | $33,041 |
| Interquartile 75% (IQ3) | $41,444 | $45,796 |
| Interquartile Range (IQR) | $11,444 | $12,755 |
| Standard Deviation (Sample) | $12,835 | $9,096 |
| Standard Deviation (Population) | $12,708 | $8,998 |
Demographics Similar to Slavs and Immigrants from Costa Rica by Median Female Earnings
In terms of median female earnings, the demographic groups most similar to Slavs are Costa Rican ($39,622, a difference of 0.020%), Immigrants from Germany ($39,603, a difference of 0.030%), Immigrants from Kenya ($39,535, a difference of 0.20%), Tsimshian ($39,530, a difference of 0.21%), and Tlingit-Haida ($39,513, a difference of 0.25%). Similarly, the demographic groups most similar to Immigrants from Costa Rica are Assyrian/Chaldean/Syriac ($39,159, a difference of 0.070%), Uruguayan ($39,228, a difference of 0.11%), Irish ($39,291, a difference of 0.27%), Immigrants from Nigeria ($39,294, a difference of 0.28%), and Immigrants ($39,328, a difference of 0.36%).
| Demographics | Rating | Rank | Median Female Earnings |
| Costa Ricans | 46.1 /100 | #177 | Average $39,622 |
| Slavs | 45.6 /100 | #178 | Average $39,613 |
| Immigrants | Germany | 45.1 /100 | #179 | Average $39,603 |
| Immigrants | Kenya | 41.6 /100 | #180 | Average $39,535 |
| Tsimshian | 41.4 /100 | #181 | Average $39,530 |
| Tlingit-Haida | 40.5 /100 | #182 | Average $39,513 |
| Hungarians | 40.3 /100 | #183 | Average $39,510 |
| Europeans | 37.7 /100 | #184 | Fair $39,457 |
| Immigrants | West Indies | 36.9 /100 | #185 | Fair $39,441 |
| Colombians | 36.9 /100 | #186 | Fair $39,439 |
| Swedes | 36.0 /100 | #187 | Fair $39,421 |
| Bermudans | 35.9 /100 | #188 | Fair $39,418 |
| Senegalese | 34.2 /100 | #189 | Fair $39,384 |
| Puget Sound Salish | 33.9 /100 | #190 | Fair $39,376 |
| Immigrants | Western Africa | 32.7 /100 | #191 | Fair $39,351 |
| Immigrants | Immigrants | 31.7 /100 | #192 | Fair $39,328 |
| Immigrants | Nigeria | 30.2 /100 | #193 | Fair $39,294 |
| Irish | 30.0 /100 | #194 | Fair $39,291 |
| Uruguayans | 27.3 /100 | #195 | Fair $39,228 |
| Immigrants | Costa Rica | 25.6 /100 | #196 | Fair $39,186 |
| Assyrians/Chaldeans/Syriacs | 24.6 /100 | #197 | Fair $39,159 |