Slavic vs Immigrants from Ethiopia Median Female Earnings
COMPARE
Slavic
Immigrants from Ethiopia
Median Female Earnings
Median Female Earnings Comparison
Slavs
Immigrants from Ethiopia
$39,613
MEDIAN FEMALE EARNINGS
45.6/ 100
METRIC RATING
178th/ 347
METRIC RANK
$42,744
MEDIAN FEMALE EARNINGS
99.8/ 100
METRIC RATING
70th/ 347
METRIC RANK
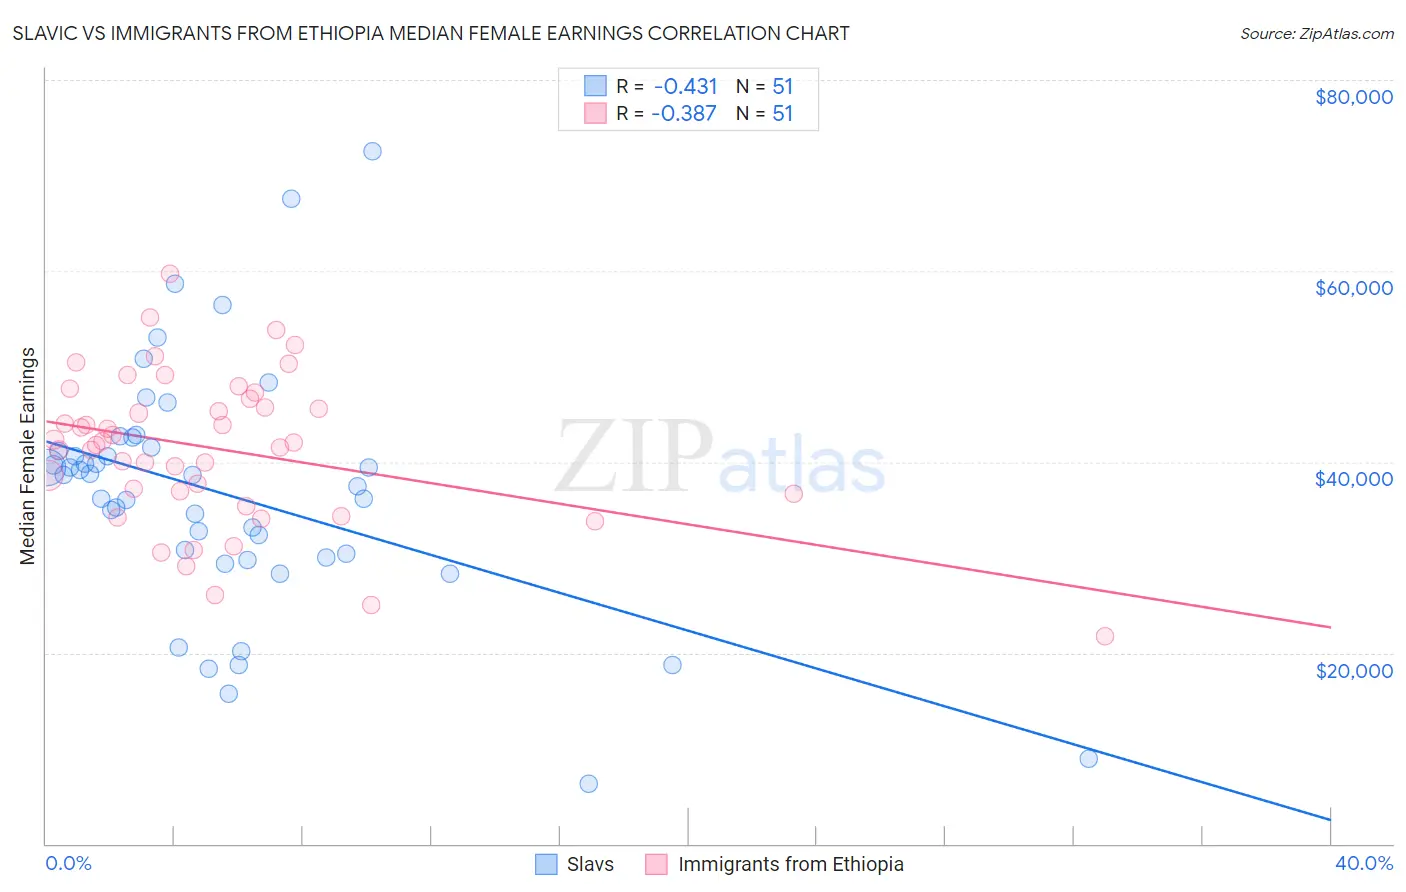
Slavic vs Immigrants from Ethiopia Median Female Earnings Correlation Chart
The statistical analysis conducted on geographies consisting of 270,801,270 people shows a moderate negative correlation between the proportion of Slavs and median female earnings in the United States with a correlation coefficient (R) of -0.431 and weighted average of $39,613. Similarly, the statistical analysis conducted on geographies consisting of 211,549,153 people shows a mild negative correlation between the proportion of Immigrants from Ethiopia and median female earnings in the United States with a correlation coefficient (R) of -0.387 and weighted average of $42,744, a difference of 7.9%.
Median Female Earnings Correlation Summary
| Measurement | Slavic | Immigrants from Ethiopia |
| Minimum | $6,250 | $21,797 |
| Maximum | $72,578 | $59,671 |
| Range | $66,328 | $37,874 |
| Mean | $36,620 | $41,343 |
| Median | $38,590 | $41,993 |
| Interquartile 25% (IQ1) | $30,000 | $36,641 |
| Interquartile 75% (IQ3) | $41,444 | $46,569 |
| Interquartile Range (IQR) | $11,444 | $9,928 |
| Standard Deviation (Sample) | $12,835 | $7,910 |
| Standard Deviation (Population) | $12,708 | $7,832 |
Similar Demographics by Median Female Earnings
Demographics Similar to Slavs by Median Female Earnings
In terms of median female earnings, the demographic groups most similar to Slavs are Costa Rican ($39,622, a difference of 0.020%), Immigrants from Germany ($39,603, a difference of 0.030%), Nigerian ($39,641, a difference of 0.070%), Immigrants from South America ($39,643, a difference of 0.080%), and Immigrants from Kenya ($39,535, a difference of 0.20%).
| Demographics | Rating | Rank | Median Female Earnings |
| Immigrants | Portugal | 54.7 /100 | #171 | Average $39,788 |
| British | 53.8 /100 | #172 | Average $39,772 |
| Canadians | 51.4 /100 | #173 | Average $39,724 |
| South Americans | 50.0 /100 | #174 | Average $39,698 |
| Immigrants | South America | 47.2 /100 | #175 | Average $39,643 |
| Nigerians | 47.0 /100 | #176 | Average $39,641 |
| Costa Ricans | 46.1 /100 | #177 | Average $39,622 |
| Slavs | 45.6 /100 | #178 | Average $39,613 |
| Immigrants | Germany | 45.1 /100 | #179 | Average $39,603 |
| Immigrants | Kenya | 41.6 /100 | #180 | Average $39,535 |
| Tsimshian | 41.4 /100 | #181 | Average $39,530 |
| Tlingit-Haida | 40.5 /100 | #182 | Average $39,513 |
| Hungarians | 40.3 /100 | #183 | Average $39,510 |
| Europeans | 37.7 /100 | #184 | Fair $39,457 |
| Immigrants | West Indies | 36.9 /100 | #185 | Fair $39,441 |
Demographics Similar to Immigrants from Ethiopia by Median Female Earnings
In terms of median female earnings, the demographic groups most similar to Immigrants from Ethiopia are Immigrants from Romania ($42,718, a difference of 0.060%), Immigrants from Spain ($42,815, a difference of 0.17%), Immigrants from Austria ($42,824, a difference of 0.19%), Immigrants from Norway ($42,837, a difference of 0.22%), and Immigrants from Egypt ($42,837, a difference of 0.22%).
| Demographics | Rating | Rank | Median Female Earnings |
| Immigrants | Ukraine | 99.9 /100 | #63 | Exceptional $43,069 |
| Immigrants | Pakistan | 99.9 /100 | #64 | Exceptional $43,052 |
| Sierra Leoneans | 99.9 /100 | #65 | Exceptional $42,868 |
| Immigrants | Norway | 99.9 /100 | #66 | Exceptional $42,837 |
| Immigrants | Egypt | 99.9 /100 | #67 | Exceptional $42,837 |
| Immigrants | Austria | 99.8 /100 | #68 | Exceptional $42,824 |
| Immigrants | Spain | 99.8 /100 | #69 | Exceptional $42,815 |
| Immigrants | Ethiopia | 99.8 /100 | #70 | Exceptional $42,744 |
| Immigrants | Romania | 99.8 /100 | #71 | Exceptional $42,718 |
| Albanians | 99.8 /100 | #72 | Exceptional $42,584 |
| Mongolians | 99.7 /100 | #73 | Exceptional $42,542 |
| Immigrants | South Africa | 99.7 /100 | #74 | Exceptional $42,508 |
| New Zealanders | 99.7 /100 | #75 | Exceptional $42,446 |
| Immigrants | Italy | 99.7 /100 | #76 | Exceptional $42,446 |
| Immigrants | Albania | 99.6 /100 | #77 | Exceptional $42,388 |