Syrian vs Hmong Median Female Earnings
COMPARE
Syrian
Hmong
Median Female Earnings
Median Female Earnings Comparison
Syrians
Hmong
$40,727
MEDIAN FEMALE EARNINGS
89.5/ 100
METRIC RATING
133rd/ 347
METRIC RANK
$35,498
MEDIAN FEMALE EARNINGS
0.0/ 100
METRIC RATING
297th/ 347
METRIC RANK
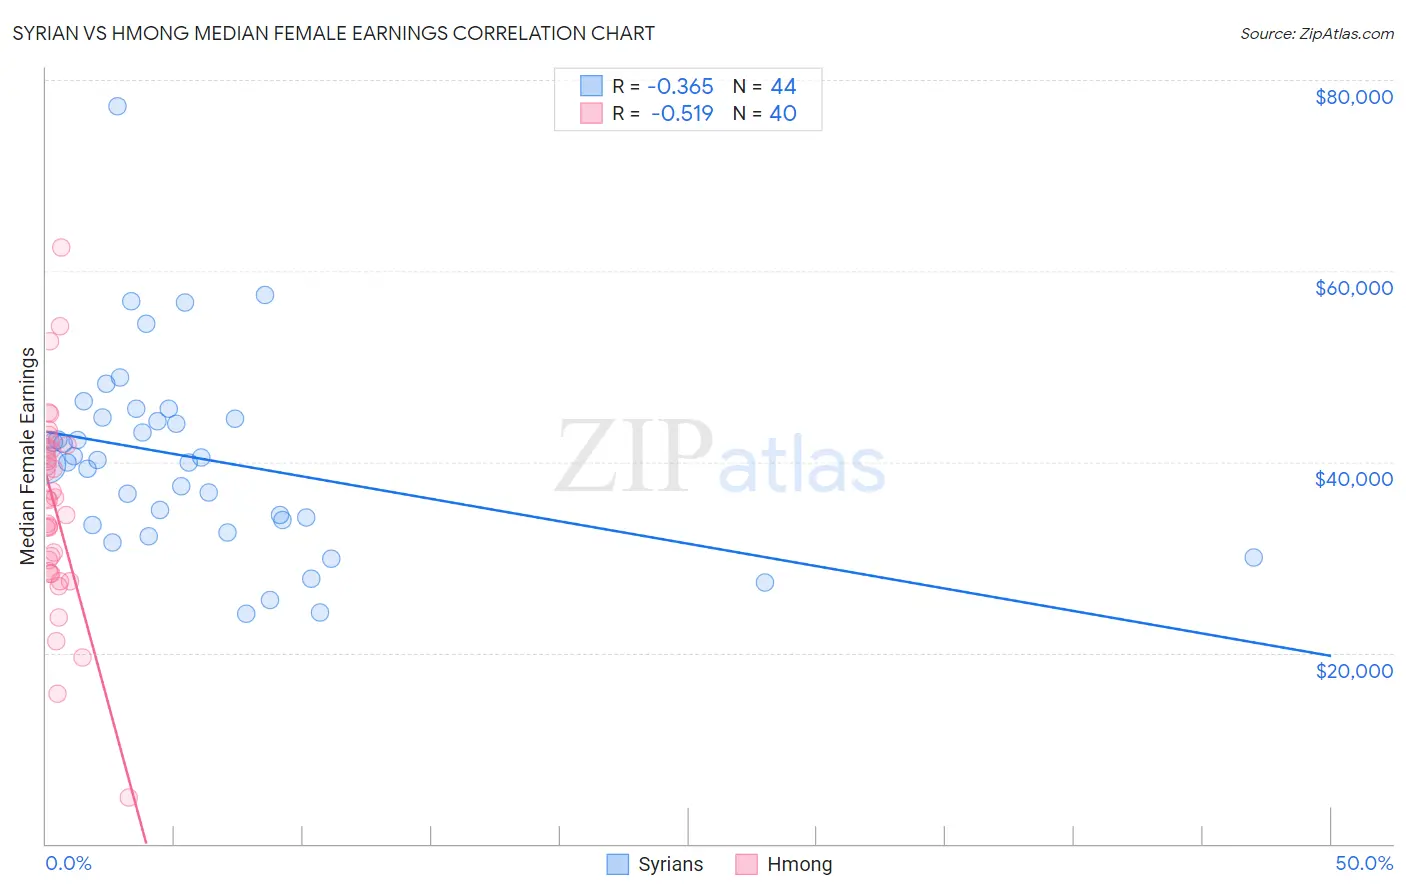
Syrian vs Hmong Median Female Earnings Correlation Chart
The statistical analysis conducted on geographies consisting of 266,269,778 people shows a mild negative correlation between the proportion of Syrians and median female earnings in the United States with a correlation coefficient (R) of -0.365 and weighted average of $40,727. Similarly, the statistical analysis conducted on geographies consisting of 24,681,537 people shows a substantial negative correlation between the proportion of Hmong and median female earnings in the United States with a correlation coefficient (R) of -0.519 and weighted average of $35,498, a difference of 14.7%.
Median Female Earnings Correlation Summary
| Measurement | Syrian | Hmong |
| Minimum | $24,091 | $4,844 |
| Maximum | $77,272 | $62,438 |
| Range | $53,181 | $57,594 |
| Mean | $40,309 | $35,172 |
| Median | $40,077 | $36,091 |
| Interquartile 25% (IQ1) | $33,656 | $28,415 |
| Interquartile 75% (IQ3) | $44,570 | $41,366 |
| Interquartile Range (IQR) | $10,914 | $12,951 |
| Standard Deviation (Sample) | $10,141 | $10,537 |
| Standard Deviation (Population) | $10,025 | $10,404 |
Similar Demographics by Median Female Earnings
Demographics Similar to Syrians by Median Female Earnings
In terms of median female earnings, the demographic groups most similar to Syrians are Arab ($40,718, a difference of 0.020%), Immigrants from Uganda ($40,739, a difference of 0.030%), Immigrants from Nepal ($40,704, a difference of 0.060%), Chilean ($40,757, a difference of 0.070%), and Immigrants from Guyana ($40,773, a difference of 0.11%).
| Demographics | Rating | Rank | Median Female Earnings |
| Immigrants | Trinidad and Tobago | 92.3 /100 | #126 | Exceptional $40,895 |
| Ugandans | 92.2 /100 | #127 | Exceptional $40,889 |
| Carpatho Rusyns | 91.2 /100 | #128 | Exceptional $40,825 |
| Zimbabweans | 90.8 /100 | #129 | Exceptional $40,798 |
| Immigrants | Guyana | 90.3 /100 | #130 | Exceptional $40,773 |
| Chileans | 90.0 /100 | #131 | Exceptional $40,757 |
| Immigrants | Uganda | 89.7 /100 | #132 | Excellent $40,739 |
| Syrians | 89.5 /100 | #133 | Excellent $40,727 |
| Arabs | 89.3 /100 | #134 | Excellent $40,718 |
| Immigrants | Nepal | 89.0 /100 | #135 | Excellent $40,704 |
| Immigrants | Eastern Africa | 87.7 /100 | #136 | Excellent $40,644 |
| Pakistanis | 86.6 /100 | #137 | Excellent $40,596 |
| Taiwanese | 86.1 /100 | #138 | Excellent $40,576 |
| Immigrants | South Eastern Asia | 85.7 /100 | #139 | Excellent $40,558 |
| Serbians | 85.2 /100 | #140 | Excellent $40,539 |
Demographics Similar to Hmong by Median Female Earnings
In terms of median female earnings, the demographic groups most similar to Hmong are Immigrants from Micronesia ($35,477, a difference of 0.060%), Immigrants from Guatemala ($35,444, a difference of 0.15%), Yuman ($35,377, a difference of 0.34%), Mexican American Indian ($35,629, a difference of 0.37%), and Comanche ($35,661, a difference of 0.46%).
| Demographics | Rating | Rank | Median Female Earnings |
| Central American Indians | 0.0 /100 | #290 | Tragic $35,930 |
| Blackfeet | 0.0 /100 | #291 | Tragic $35,864 |
| Americans | 0.0 /100 | #292 | Tragic $35,777 |
| Guatemalans | 0.0 /100 | #293 | Tragic $35,695 |
| Cheyenne | 0.0 /100 | #294 | Tragic $35,673 |
| Comanche | 0.0 /100 | #295 | Tragic $35,661 |
| Mexican American Indians | 0.0 /100 | #296 | Tragic $35,629 |
| Hmong | 0.0 /100 | #297 | Tragic $35,498 |
| Immigrants | Micronesia | 0.0 /100 | #298 | Tragic $35,477 |
| Immigrants | Guatemala | 0.0 /100 | #299 | Tragic $35,444 |
| Yuman | 0.0 /100 | #300 | Tragic $35,377 |
| Pima | 0.0 /100 | #301 | Tragic $35,326 |
| Blacks/African Americans | 0.0 /100 | #302 | Tragic $35,315 |
| Immigrants | Latin America | 0.0 /100 | #303 | Tragic $35,307 |
| Crow | 0.0 /100 | #304 | Tragic $35,266 |