Slavic vs Bolivian Median Female Earnings
COMPARE
Slavic
Bolivian
Median Female Earnings
Median Female Earnings Comparison
Slavs
Bolivians
$39,613
MEDIAN FEMALE EARNINGS
45.6/ 100
METRIC RATING
178th/ 347
METRIC RANK
$43,445
MEDIAN FEMALE EARNINGS
100.0/ 100
METRIC RATING
47th/ 347
METRIC RANK
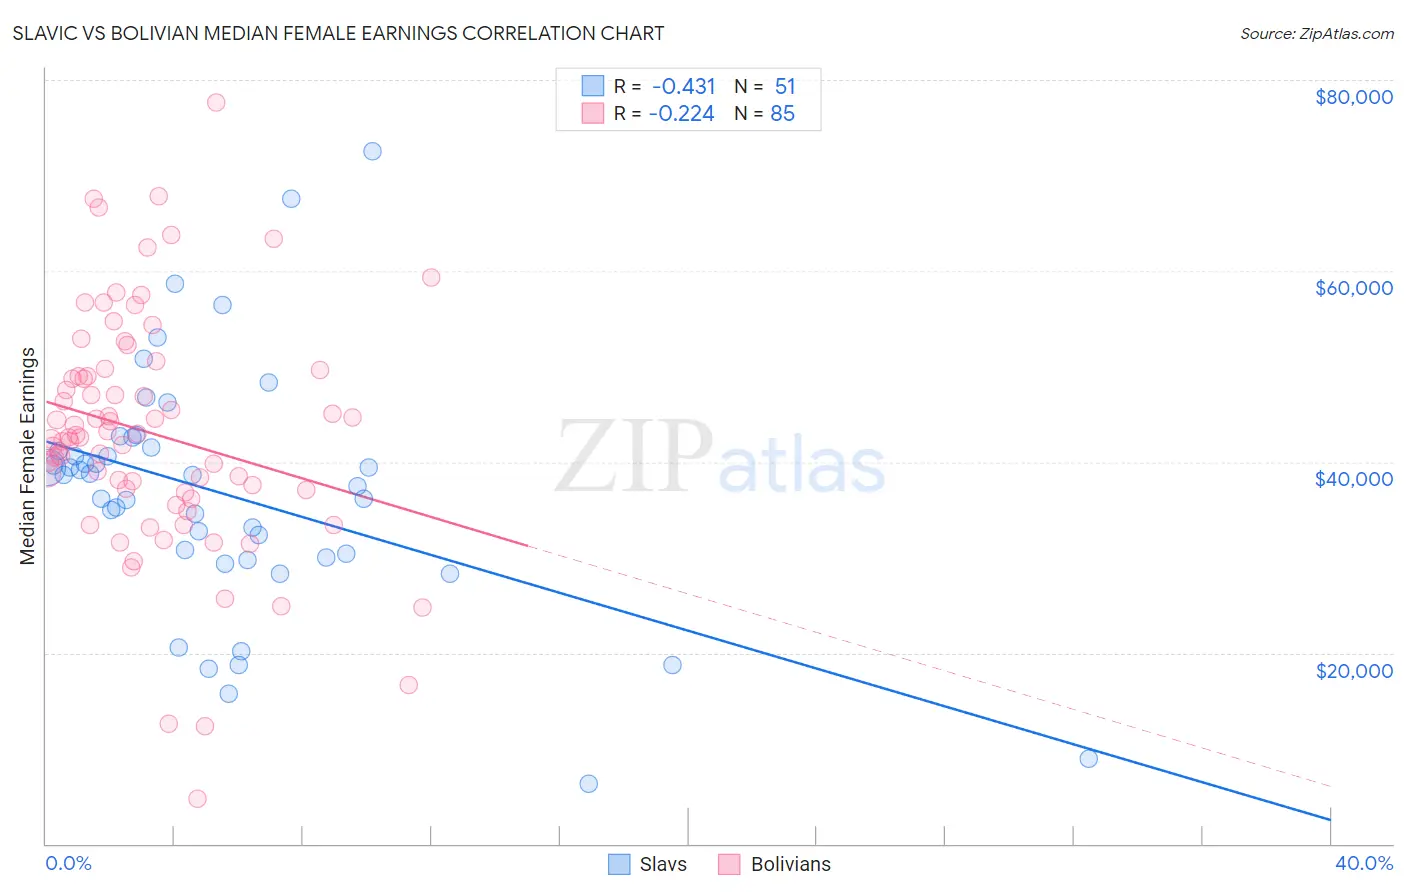
Slavic vs Bolivian Median Female Earnings Correlation Chart
The statistical analysis conducted on geographies consisting of 270,801,270 people shows a moderate negative correlation between the proportion of Slavs and median female earnings in the United States with a correlation coefficient (R) of -0.431 and weighted average of $39,613. Similarly, the statistical analysis conducted on geographies consisting of 184,667,503 people shows a weak negative correlation between the proportion of Bolivians and median female earnings in the United States with a correlation coefficient (R) of -0.224 and weighted average of $43,445, a difference of 9.7%.
Median Female Earnings Correlation Summary
| Measurement | Slavic | Bolivian |
| Minimum | $6,250 | $4,682 |
| Maximum | $72,578 | $77,679 |
| Range | $66,328 | $72,997 |
| Mean | $36,620 | $42,989 |
| Median | $38,590 | $42,606 |
| Interquartile 25% (IQ1) | $30,000 | $36,934 |
| Interquartile 75% (IQ3) | $41,444 | $49,332 |
| Interquartile Range (IQR) | $11,444 | $12,397 |
| Standard Deviation (Sample) | $12,835 | $12,507 |
| Standard Deviation (Population) | $12,708 | $12,433 |
Similar Demographics by Median Female Earnings
Demographics Similar to Slavs by Median Female Earnings
In terms of median female earnings, the demographic groups most similar to Slavs are Costa Rican ($39,622, a difference of 0.020%), Immigrants from Germany ($39,603, a difference of 0.030%), Nigerian ($39,641, a difference of 0.070%), Immigrants from South America ($39,643, a difference of 0.080%), and Immigrants from Kenya ($39,535, a difference of 0.20%).
| Demographics | Rating | Rank | Median Female Earnings |
| Immigrants | Portugal | 54.7 /100 | #171 | Average $39,788 |
| British | 53.8 /100 | #172 | Average $39,772 |
| Canadians | 51.4 /100 | #173 | Average $39,724 |
| South Americans | 50.0 /100 | #174 | Average $39,698 |
| Immigrants | South America | 47.2 /100 | #175 | Average $39,643 |
| Nigerians | 47.0 /100 | #176 | Average $39,641 |
| Costa Ricans | 46.1 /100 | #177 | Average $39,622 |
| Slavs | 45.6 /100 | #178 | Average $39,613 |
| Immigrants | Germany | 45.1 /100 | #179 | Average $39,603 |
| Immigrants | Kenya | 41.6 /100 | #180 | Average $39,535 |
| Tsimshian | 41.4 /100 | #181 | Average $39,530 |
| Tlingit-Haida | 40.5 /100 | #182 | Average $39,513 |
| Hungarians | 40.3 /100 | #183 | Average $39,510 |
| Europeans | 37.7 /100 | #184 | Fair $39,457 |
| Immigrants | West Indies | 36.9 /100 | #185 | Fair $39,441 |
Demographics Similar to Bolivians by Median Female Earnings
In terms of median female earnings, the demographic groups most similar to Bolivians are Immigrants from Bolivia ($43,467, a difference of 0.050%), Immigrants from Indonesia ($43,412, a difference of 0.070%), Immigrants from Serbia ($43,385, a difference of 0.14%), Immigrants from Europe ($43,523, a difference of 0.18%), and Immigrants from Uzbekistan ($43,363, a difference of 0.19%).
| Demographics | Rating | Rank | Median Female Earnings |
| Immigrants | Malaysia | 100.0 /100 | #40 | Exceptional $43,835 |
| Bhutanese | 100.0 /100 | #41 | Exceptional $43,648 |
| Immigrants | Denmark | 100.0 /100 | #42 | Exceptional $43,646 |
| Bulgarians | 100.0 /100 | #43 | Exceptional $43,638 |
| Immigrants | Czechoslovakia | 100.0 /100 | #44 | Exceptional $43,571 |
| Immigrants | Europe | 100.0 /100 | #45 | Exceptional $43,523 |
| Immigrants | Bolivia | 100.0 /100 | #46 | Exceptional $43,467 |
| Bolivians | 100.0 /100 | #47 | Exceptional $43,445 |
| Immigrants | Indonesia | 100.0 /100 | #48 | Exceptional $43,412 |
| Immigrants | Serbia | 100.0 /100 | #49 | Exceptional $43,385 |
| Immigrants | Uzbekistan | 100.0 /100 | #50 | Exceptional $43,363 |
| Maltese | 100.0 /100 | #51 | Exceptional $43,357 |
| Immigrants | Lithuania | 99.9 /100 | #52 | Exceptional $43,317 |
| Immigrants | Eastern Europe | 99.9 /100 | #53 | Exceptional $43,309 |
| Australians | 99.9 /100 | #54 | Exceptional $43,308 |