Slavic vs Icelander Median Female Earnings
COMPARE
Slavic
Icelander
Median Female Earnings
Median Female Earnings Comparison
Slavs
Icelanders
$39,613
MEDIAN FEMALE EARNINGS
45.6/ 100
METRIC RATING
178th/ 347
METRIC RANK
$39,109
MEDIAN FEMALE EARNINGS
22.7/ 100
METRIC RATING
199th/ 347
METRIC RANK
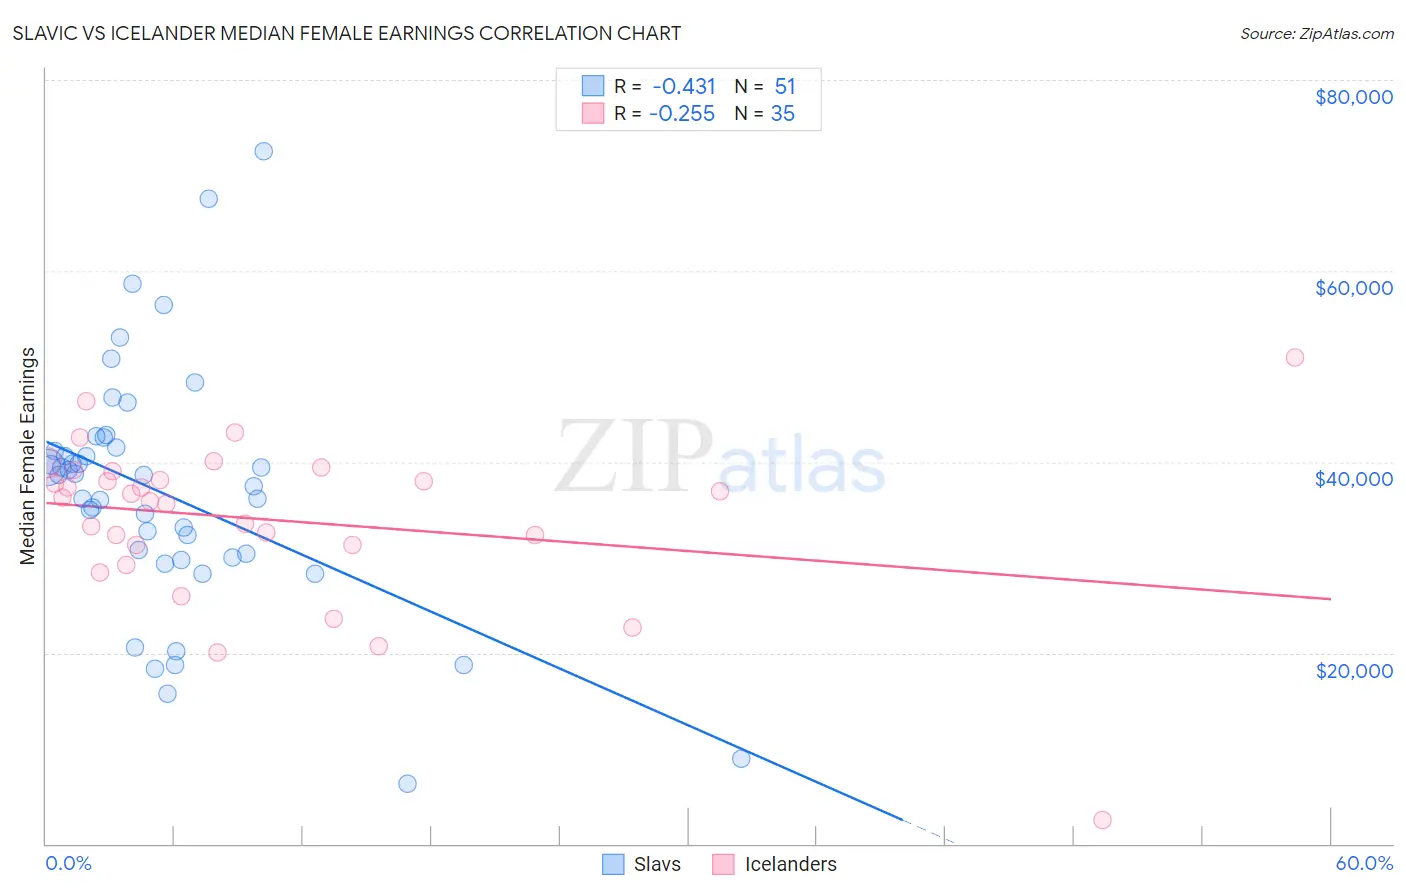
Slavic vs Icelander Median Female Earnings Correlation Chart
The statistical analysis conducted on geographies consisting of 270,801,270 people shows a moderate negative correlation between the proportion of Slavs and median female earnings in the United States with a correlation coefficient (R) of -0.431 and weighted average of $39,613. Similarly, the statistical analysis conducted on geographies consisting of 159,641,354 people shows a weak negative correlation between the proportion of Icelanders and median female earnings in the United States with a correlation coefficient (R) of -0.255 and weighted average of $39,109, a difference of 1.3%.
Median Female Earnings Correlation Summary
| Measurement | Slavic | Icelander |
| Minimum | $6,250 | $2,499 |
| Maximum | $72,578 | $50,938 |
| Range | $66,328 | $48,439 |
| Mean | $36,620 | $33,934 |
| Median | $38,590 | $36,326 |
| Interquartile 25% (IQ1) | $30,000 | $31,250 |
| Interquartile 75% (IQ3) | $41,444 | $39,051 |
| Interquartile Range (IQR) | $11,444 | $7,801 |
| Standard Deviation (Sample) | $12,835 | $8,758 |
| Standard Deviation (Population) | $12,708 | $8,632 |
Similar Demographics by Median Female Earnings
Demographics Similar to Slavs by Median Female Earnings
In terms of median female earnings, the demographic groups most similar to Slavs are Costa Rican ($39,622, a difference of 0.020%), Immigrants from Germany ($39,603, a difference of 0.030%), Nigerian ($39,641, a difference of 0.070%), Immigrants from South America ($39,643, a difference of 0.080%), and Immigrants from Kenya ($39,535, a difference of 0.20%).
| Demographics | Rating | Rank | Median Female Earnings |
| Immigrants | Portugal | 54.7 /100 | #171 | Average $39,788 |
| British | 53.8 /100 | #172 | Average $39,772 |
| Canadians | 51.4 /100 | #173 | Average $39,724 |
| South Americans | 50.0 /100 | #174 | Average $39,698 |
| Immigrants | South America | 47.2 /100 | #175 | Average $39,643 |
| Nigerians | 47.0 /100 | #176 | Average $39,641 |
| Costa Ricans | 46.1 /100 | #177 | Average $39,622 |
| Slavs | 45.6 /100 | #178 | Average $39,613 |
| Immigrants | Germany | 45.1 /100 | #179 | Average $39,603 |
| Immigrants | Kenya | 41.6 /100 | #180 | Average $39,535 |
| Tsimshian | 41.4 /100 | #181 | Average $39,530 |
| Tlingit-Haida | 40.5 /100 | #182 | Average $39,513 |
| Hungarians | 40.3 /100 | #183 | Average $39,510 |
| Europeans | 37.7 /100 | #184 | Fair $39,457 |
| Immigrants | West Indies | 36.9 /100 | #185 | Fair $39,441 |
Demographics Similar to Icelanders by Median Female Earnings
In terms of median female earnings, the demographic groups most similar to Icelanders are Ecuadorian ($39,117, a difference of 0.020%), Assyrian/Chaldean/Syriac ($39,159, a difference of 0.13%), Immigrants from Panama ($39,049, a difference of 0.15%), Panamanian ($39,049, a difference of 0.15%), and Immigrants from Costa Rica ($39,186, a difference of 0.20%).
| Demographics | Rating | Rank | Median Female Earnings |
| Immigrants | Immigrants | 31.7 /100 | #192 | Fair $39,328 |
| Immigrants | Nigeria | 30.2 /100 | #193 | Fair $39,294 |
| Irish | 30.0 /100 | #194 | Fair $39,291 |
| Uruguayans | 27.3 /100 | #195 | Fair $39,228 |
| Immigrants | Costa Rica | 25.6 /100 | #196 | Fair $39,186 |
| Assyrians/Chaldeans/Syriacs | 24.6 /100 | #197 | Fair $39,159 |
| Ecuadorians | 23.0 /100 | #198 | Fair $39,117 |
| Icelanders | 22.7 /100 | #199 | Fair $39,109 |
| Immigrants | Panama | 20.6 /100 | #200 | Fair $39,049 |
| Panamanians | 20.6 /100 | #201 | Fair $39,049 |
| Slovaks | 19.9 /100 | #202 | Poor $39,029 |
| Czechs | 18.7 /100 | #203 | Poor $38,992 |
| Immigrants | Uruguay | 17.3 /100 | #204 | Poor $38,945 |
| Immigrants | Colombia | 16.3 /100 | #205 | Poor $38,913 |
| Immigrants | Bosnia and Herzegovina | 15.6 /100 | #206 | Poor $38,886 |