German vs Hmong Median Female Earnings
COMPARE
German
Hmong
Median Female Earnings
Median Female Earnings Comparison
Germans
Hmong
$37,986
MEDIAN FEMALE EARNINGS
2.8/ 100
METRIC RATING
243rd/ 347
METRIC RANK
$35,498
MEDIAN FEMALE EARNINGS
0.0/ 100
METRIC RATING
297th/ 347
METRIC RANK
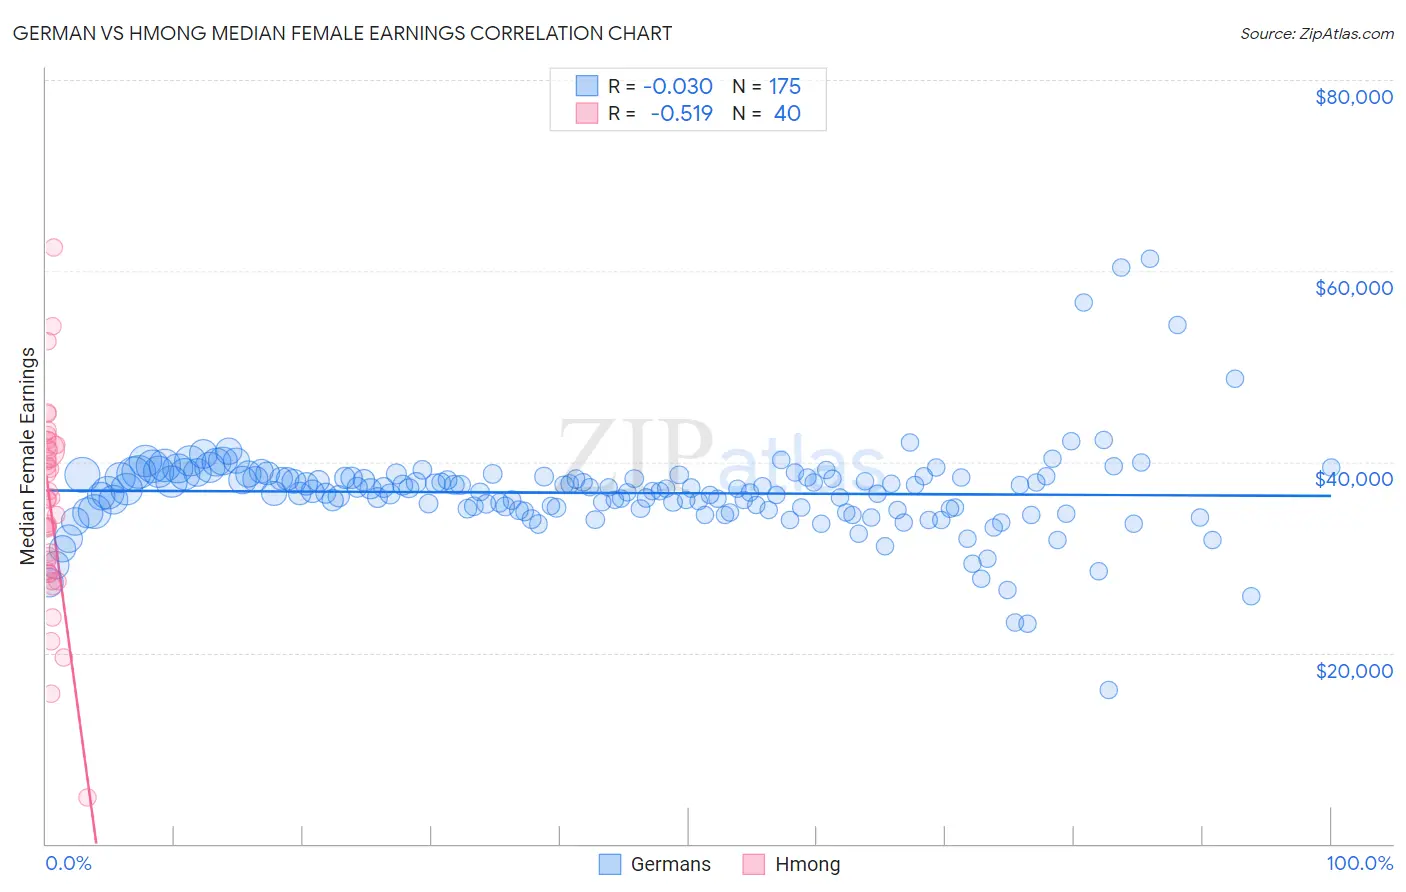
German vs Hmong Median Female Earnings Correlation Chart
The statistical analysis conducted on geographies consisting of 578,410,378 people shows no correlation between the proportion of Germans and median female earnings in the United States with a correlation coefficient (R) of -0.030 and weighted average of $37,986. Similarly, the statistical analysis conducted on geographies consisting of 24,681,537 people shows a substantial negative correlation between the proportion of Hmong and median female earnings in the United States with a correlation coefficient (R) of -0.519 and weighted average of $35,498, a difference of 7.0%.
Median Female Earnings Correlation Summary
| Measurement | German | Hmong |
| Minimum | $16,161 | $4,844 |
| Maximum | $61,250 | $62,438 |
| Range | $45,089 | $57,594 |
| Mean | $36,748 | $35,172 |
| Median | $36,985 | $36,091 |
| Interquartile 25% (IQ1) | $34,926 | $28,415 |
| Interquartile 75% (IQ3) | $38,384 | $41,366 |
| Interquartile Range (IQR) | $3,458 | $12,951 |
| Standard Deviation (Sample) | $4,922 | $10,537 |
| Standard Deviation (Population) | $4,908 | $10,404 |
Similar Demographics by Median Female Earnings
Demographics Similar to Germans by Median Female Earnings
In terms of median female earnings, the demographic groups most similar to Germans are Immigrants from Liberia ($37,970, a difference of 0.040%), Immigrants from Middle Africa ($37,965, a difference of 0.050%), Delaware ($37,964, a difference of 0.060%), Immigrants from Burma/Myanmar ($38,028, a difference of 0.11%), and Immigrants from Somalia ($37,914, a difference of 0.19%).
| Demographics | Rating | Rank | Median Female Earnings |
| Liberians | 4.4 /100 | #236 | Tragic $38,215 |
| Immigrants | Cabo Verde | 4.3 /100 | #237 | Tragic $38,208 |
| Alaska Natives | 4.3 /100 | #238 | Tragic $38,202 |
| English | 4.2 /100 | #239 | Tragic $38,196 |
| Finns | 4.0 /100 | #240 | Tragic $38,173 |
| Spanish | 3.5 /100 | #241 | Tragic $38,098 |
| Immigrants | Burma/Myanmar | 3.0 /100 | #242 | Tragic $38,028 |
| Germans | 2.8 /100 | #243 | Tragic $37,986 |
| Immigrants | Liberia | 2.7 /100 | #244 | Tragic $37,970 |
| Immigrants | Middle Africa | 2.7 /100 | #245 | Tragic $37,965 |
| Delaware | 2.6 /100 | #246 | Tragic $37,964 |
| Immigrants | Somalia | 2.4 /100 | #247 | Tragic $37,914 |
| Alaskan Athabascans | 2.3 /100 | #248 | Tragic $37,905 |
| Swiss | 2.3 /100 | #249 | Tragic $37,904 |
| Immigrants | Iraq | 2.2 /100 | #250 | Tragic $37,864 |
Demographics Similar to Hmong by Median Female Earnings
In terms of median female earnings, the demographic groups most similar to Hmong are Immigrants from Micronesia ($35,477, a difference of 0.060%), Immigrants from Guatemala ($35,444, a difference of 0.15%), Yuman ($35,377, a difference of 0.34%), Mexican American Indian ($35,629, a difference of 0.37%), and Comanche ($35,661, a difference of 0.46%).
| Demographics | Rating | Rank | Median Female Earnings |
| Central American Indians | 0.0 /100 | #290 | Tragic $35,930 |
| Blackfeet | 0.0 /100 | #291 | Tragic $35,864 |
| Americans | 0.0 /100 | #292 | Tragic $35,777 |
| Guatemalans | 0.0 /100 | #293 | Tragic $35,695 |
| Cheyenne | 0.0 /100 | #294 | Tragic $35,673 |
| Comanche | 0.0 /100 | #295 | Tragic $35,661 |
| Mexican American Indians | 0.0 /100 | #296 | Tragic $35,629 |
| Hmong | 0.0 /100 | #297 | Tragic $35,498 |
| Immigrants | Micronesia | 0.0 /100 | #298 | Tragic $35,477 |
| Immigrants | Guatemala | 0.0 /100 | #299 | Tragic $35,444 |
| Yuman | 0.0 /100 | #300 | Tragic $35,377 |
| Pima | 0.0 /100 | #301 | Tragic $35,326 |
| Blacks/African Americans | 0.0 /100 | #302 | Tragic $35,315 |
| Immigrants | Latin America | 0.0 /100 | #303 | Tragic $35,307 |
| Crow | 0.0 /100 | #304 | Tragic $35,266 |