Slavic vs Pennsylvania German Median Female Earnings
COMPARE
Slavic
Pennsylvania German
Median Female Earnings
Median Female Earnings Comparison
Slavs
Pennsylvania Germans
$39,613
MEDIAN FEMALE EARNINGS
45.6/ 100
METRIC RATING
178th/ 347
METRIC RANK
$34,802
MEDIAN FEMALE EARNINGS
0.0/ 100
METRIC RATING
315th/ 347
METRIC RANK
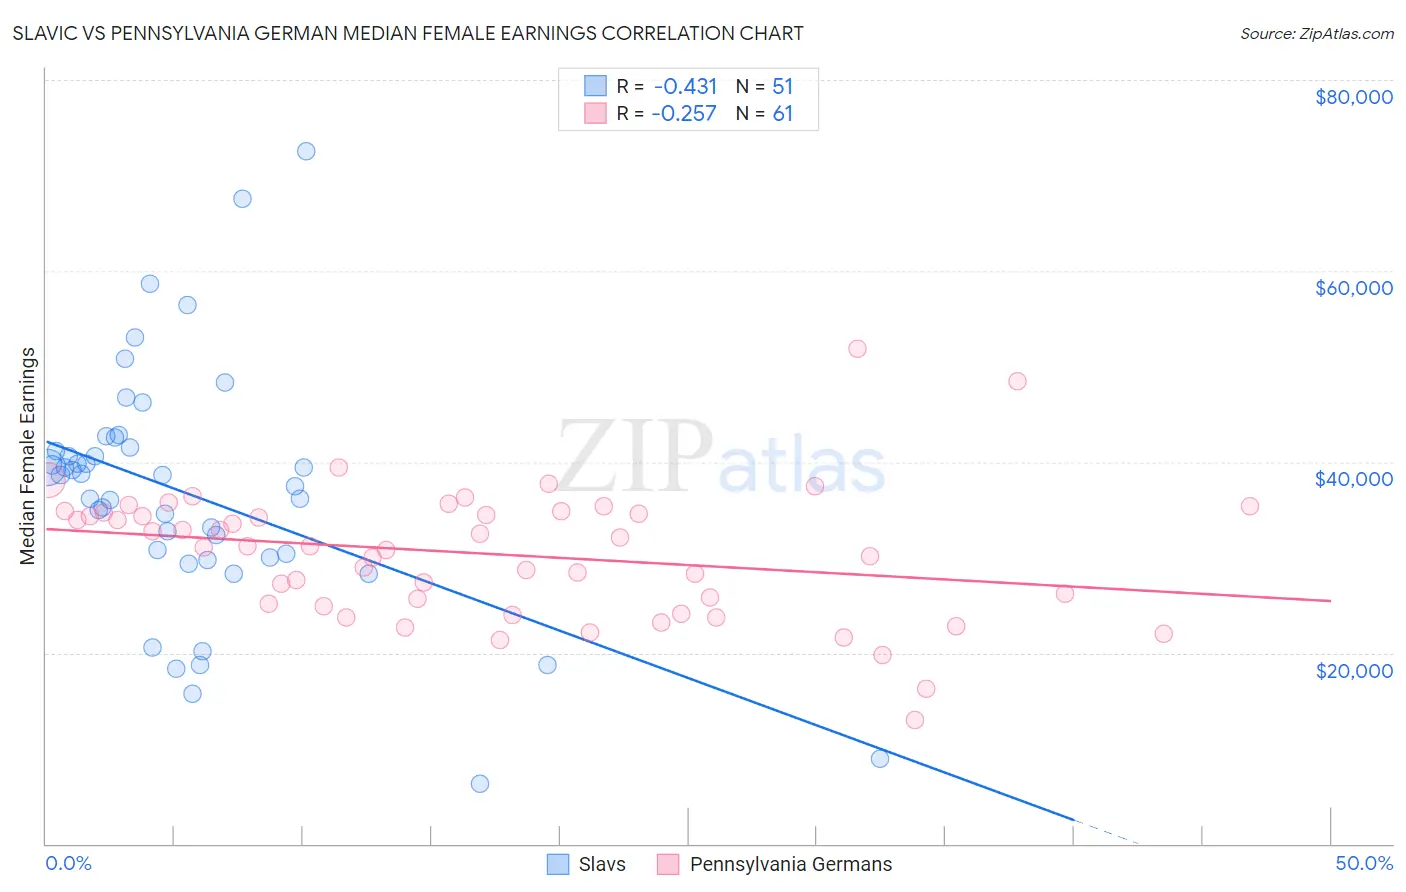
Slavic vs Pennsylvania German Median Female Earnings Correlation Chart
The statistical analysis conducted on geographies consisting of 270,801,270 people shows a moderate negative correlation between the proportion of Slavs and median female earnings in the United States with a correlation coefficient (R) of -0.431 and weighted average of $39,613. Similarly, the statistical analysis conducted on geographies consisting of 233,955,345 people shows a weak negative correlation between the proportion of Pennsylvania Germans and median female earnings in the United States with a correlation coefficient (R) of -0.257 and weighted average of $34,802, a difference of 13.8%.
Median Female Earnings Correlation Summary
| Measurement | Slavic | Pennsylvania German |
| Minimum | $6,250 | $12,961 |
| Maximum | $72,578 | $51,875 |
| Range | $66,328 | $38,914 |
| Mean | $36,620 | $30,372 |
| Median | $38,590 | $31,194 |
| Interquartile 25% (IQ1) | $30,000 | $25,044 |
| Interquartile 75% (IQ3) | $41,444 | $34,733 |
| Interquartile Range (IQR) | $11,444 | $9,690 |
| Standard Deviation (Sample) | $12,835 | $6,887 |
| Standard Deviation (Population) | $12,708 | $6,830 |
Similar Demographics by Median Female Earnings
Demographics Similar to Slavs by Median Female Earnings
In terms of median female earnings, the demographic groups most similar to Slavs are Costa Rican ($39,622, a difference of 0.020%), Immigrants from Germany ($39,603, a difference of 0.030%), Nigerian ($39,641, a difference of 0.070%), Immigrants from South America ($39,643, a difference of 0.080%), and Immigrants from Kenya ($39,535, a difference of 0.20%).
| Demographics | Rating | Rank | Median Female Earnings |
| Immigrants | Portugal | 54.7 /100 | #171 | Average $39,788 |
| British | 53.8 /100 | #172 | Average $39,772 |
| Canadians | 51.4 /100 | #173 | Average $39,724 |
| South Americans | 50.0 /100 | #174 | Average $39,698 |
| Immigrants | South America | 47.2 /100 | #175 | Average $39,643 |
| Nigerians | 47.0 /100 | #176 | Average $39,641 |
| Costa Ricans | 46.1 /100 | #177 | Average $39,622 |
| Slavs | 45.6 /100 | #178 | Average $39,613 |
| Immigrants | Germany | 45.1 /100 | #179 | Average $39,603 |
| Immigrants | Kenya | 41.6 /100 | #180 | Average $39,535 |
| Tsimshian | 41.4 /100 | #181 | Average $39,530 |
| Tlingit-Haida | 40.5 /100 | #182 | Average $39,513 |
| Hungarians | 40.3 /100 | #183 | Average $39,510 |
| Europeans | 37.7 /100 | #184 | Fair $39,457 |
| Immigrants | West Indies | 36.9 /100 | #185 | Fair $39,441 |
Demographics Similar to Pennsylvania Germans by Median Female Earnings
In terms of median female earnings, the demographic groups most similar to Pennsylvania Germans are Cherokee ($34,742, a difference of 0.17%), Potawatomi ($34,739, a difference of 0.18%), Apache ($34,895, a difference of 0.27%), Immigrants from Yemen ($34,693, a difference of 0.31%), and Shoshone ($34,677, a difference of 0.36%).
| Demographics | Rating | Rank | Median Female Earnings |
| Immigrants | Bahamas | 0.0 /100 | #308 | Tragic $35,027 |
| Hondurans | 0.0 /100 | #309 | Tragic $35,013 |
| Chippewa | 0.0 /100 | #310 | Tragic $35,003 |
| Ute | 0.0 /100 | #311 | Tragic $34,960 |
| Yaqui | 0.0 /100 | #312 | Tragic $34,943 |
| Cubans | 0.0 /100 | #313 | Tragic $34,942 |
| Apache | 0.0 /100 | #314 | Tragic $34,895 |
| Pennsylvania Germans | 0.0 /100 | #315 | Tragic $34,802 |
| Cherokee | 0.0 /100 | #316 | Tragic $34,742 |
| Potawatomi | 0.0 /100 | #317 | Tragic $34,739 |
| Immigrants | Yemen | 0.0 /100 | #318 | Tragic $34,693 |
| Shoshone | 0.0 /100 | #319 | Tragic $34,677 |
| Immigrants | Honduras | 0.0 /100 | #320 | Tragic $34,647 |
| Hispanics or Latinos | 0.0 /100 | #321 | Tragic $34,421 |
| Chickasaw | 0.0 /100 | #322 | Tragic $34,414 |