Slavic vs Immigrants from Greece Median Female Earnings
COMPARE
Slavic
Immigrants from Greece
Median Female Earnings
Median Female Earnings Comparison
Slavs
Immigrants from Greece
$39,613
MEDIAN FEMALE EARNINGS
45.6/ 100
METRIC RATING
178th/ 347
METRIC RANK
$44,976
MEDIAN FEMALE EARNINGS
100.0/ 100
METRIC RATING
22nd/ 347
METRIC RANK
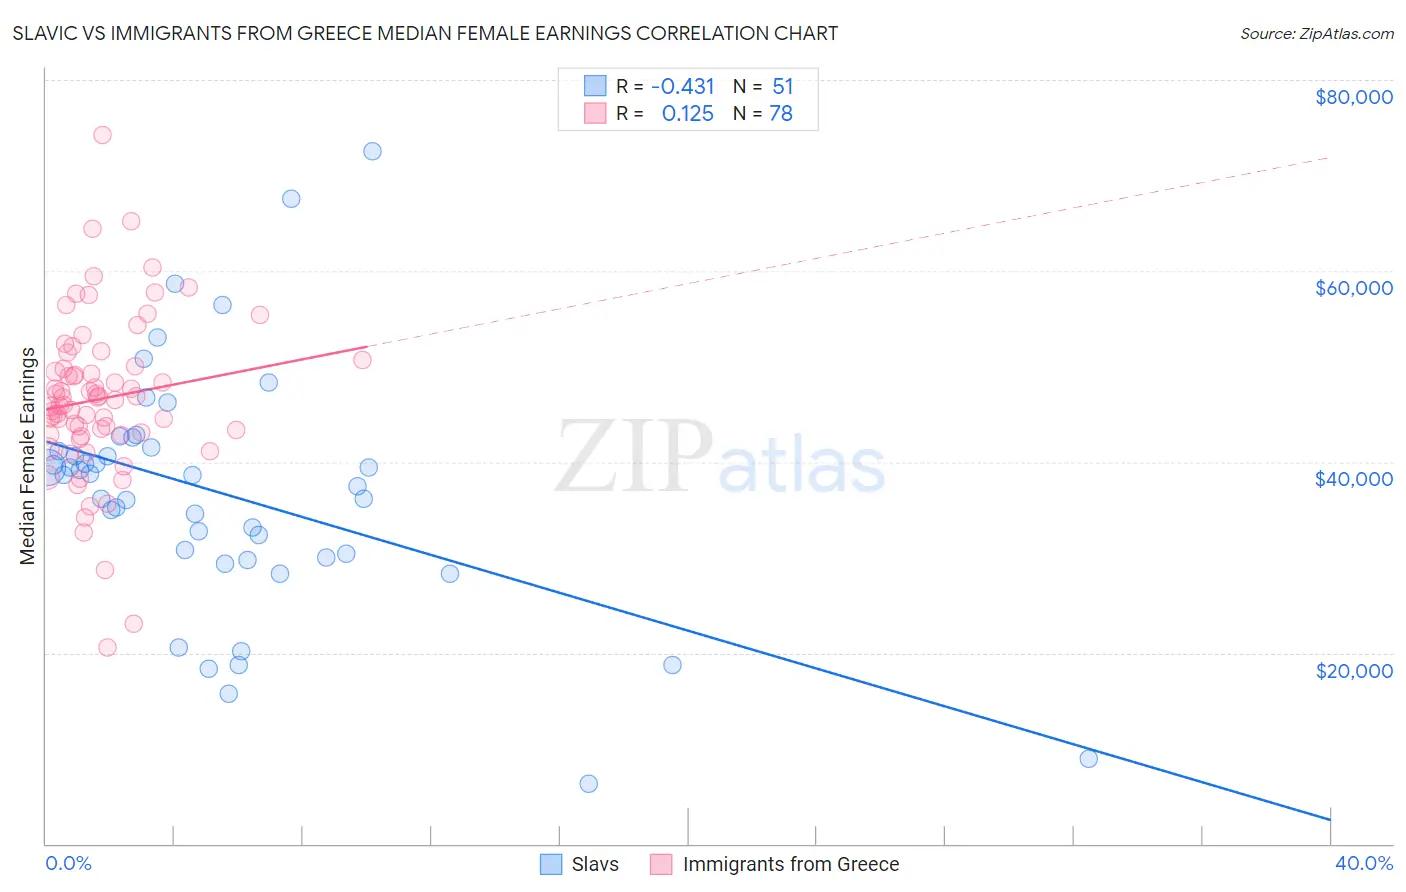
Slavic vs Immigrants from Greece Median Female Earnings Correlation Chart
The statistical analysis conducted on geographies consisting of 270,801,270 people shows a moderate negative correlation between the proportion of Slavs and median female earnings in the United States with a correlation coefficient (R) of -0.431 and weighted average of $39,613. Similarly, the statistical analysis conducted on geographies consisting of 216,834,744 people shows a poor positive correlation between the proportion of Immigrants from Greece and median female earnings in the United States with a correlation coefficient (R) of 0.125 and weighted average of $44,976, a difference of 13.5%.
Median Female Earnings Correlation Summary
| Measurement | Slavic | Immigrants from Greece |
| Minimum | $6,250 | $20,568 |
| Maximum | $72,578 | $74,175 |
| Range | $66,328 | $53,607 |
| Mean | $36,620 | $46,608 |
| Median | $38,590 | $46,610 |
| Interquartile 25% (IQ1) | $30,000 | $42,848 |
| Interquartile 75% (IQ3) | $41,444 | $50,040 |
| Interquartile Range (IQR) | $11,444 | $7,192 |
| Standard Deviation (Sample) | $12,835 | $8,519 |
| Standard Deviation (Population) | $12,708 | $8,464 |
Similar Demographics by Median Female Earnings
Demographics Similar to Slavs by Median Female Earnings
In terms of median female earnings, the demographic groups most similar to Slavs are Costa Rican ($39,622, a difference of 0.020%), Immigrants from Germany ($39,603, a difference of 0.030%), Nigerian ($39,641, a difference of 0.070%), Immigrants from South America ($39,643, a difference of 0.080%), and Immigrants from Kenya ($39,535, a difference of 0.20%).
| Demographics | Rating | Rank | Median Female Earnings |
| Immigrants | Portugal | 54.7 /100 | #171 | Average $39,788 |
| British | 53.8 /100 | #172 | Average $39,772 |
| Canadians | 51.4 /100 | #173 | Average $39,724 |
| South Americans | 50.0 /100 | #174 | Average $39,698 |
| Immigrants | South America | 47.2 /100 | #175 | Average $39,643 |
| Nigerians | 47.0 /100 | #176 | Average $39,641 |
| Costa Ricans | 46.1 /100 | #177 | Average $39,622 |
| Slavs | 45.6 /100 | #178 | Average $39,613 |
| Immigrants | Germany | 45.1 /100 | #179 | Average $39,603 |
| Immigrants | Kenya | 41.6 /100 | #180 | Average $39,535 |
| Tsimshian | 41.4 /100 | #181 | Average $39,530 |
| Tlingit-Haida | 40.5 /100 | #182 | Average $39,513 |
| Hungarians | 40.3 /100 | #183 | Average $39,510 |
| Europeans | 37.7 /100 | #184 | Fair $39,457 |
| Immigrants | West Indies | 36.9 /100 | #185 | Fair $39,441 |
Demographics Similar to Immigrants from Greece by Median Female Earnings
In terms of median female earnings, the demographic groups most similar to Immigrants from Greece are Cambodian ($45,014, a difference of 0.080%), Burmese ($44,911, a difference of 0.14%), Immigrants from Korea ($44,847, a difference of 0.29%), Immigrants from Sweden ($44,774, a difference of 0.45%), and Immigrants from Belarus ($44,757, a difference of 0.49%).
| Demographics | Rating | Rank | Median Female Earnings |
| Immigrants | Eastern Asia | 100.0 /100 | #15 | Exceptional $46,502 |
| Indians (Asian) | 100.0 /100 | #16 | Exceptional $46,481 |
| Immigrants | South Central Asia | 100.0 /100 | #17 | Exceptional $46,324 |
| Cypriots | 100.0 /100 | #18 | Exceptional $45,570 |
| Eastern Europeans | 100.0 /100 | #19 | Exceptional $45,385 |
| Immigrants | Japan | 100.0 /100 | #20 | Exceptional $45,323 |
| Cambodians | 100.0 /100 | #21 | Exceptional $45,014 |
| Immigrants | Greece | 100.0 /100 | #22 | Exceptional $44,976 |
| Burmese | 100.0 /100 | #23 | Exceptional $44,911 |
| Immigrants | Korea | 100.0 /100 | #24 | Exceptional $44,847 |
| Immigrants | Sweden | 100.0 /100 | #25 | Exceptional $44,774 |
| Immigrants | Belarus | 100.0 /100 | #26 | Exceptional $44,757 |
| Turks | 100.0 /100 | #27 | Exceptional $44,695 |
| Immigrants | Russia | 100.0 /100 | #28 | Exceptional $44,680 |
| Immigrants | Belgium | 100.0 /100 | #29 | Exceptional $44,587 |