Scotch-Irish vs Jordanian Householder Income Under 25 years
COMPARE
Scotch-Irish
Jordanian
Householder Income Under 25 years
Householder Income Under 25 years Comparison
Scotch-Irish
Jordanians
$49,039
HOUSEHOLDER INCOME UNDER 25 YEARS
0.0/ 100
METRIC RATING
285th/ 347
METRIC RANK
$51,796
HOUSEHOLDER INCOME UNDER 25 YEARS
27.6/ 100
METRIC RATING
182nd/ 347
METRIC RANK
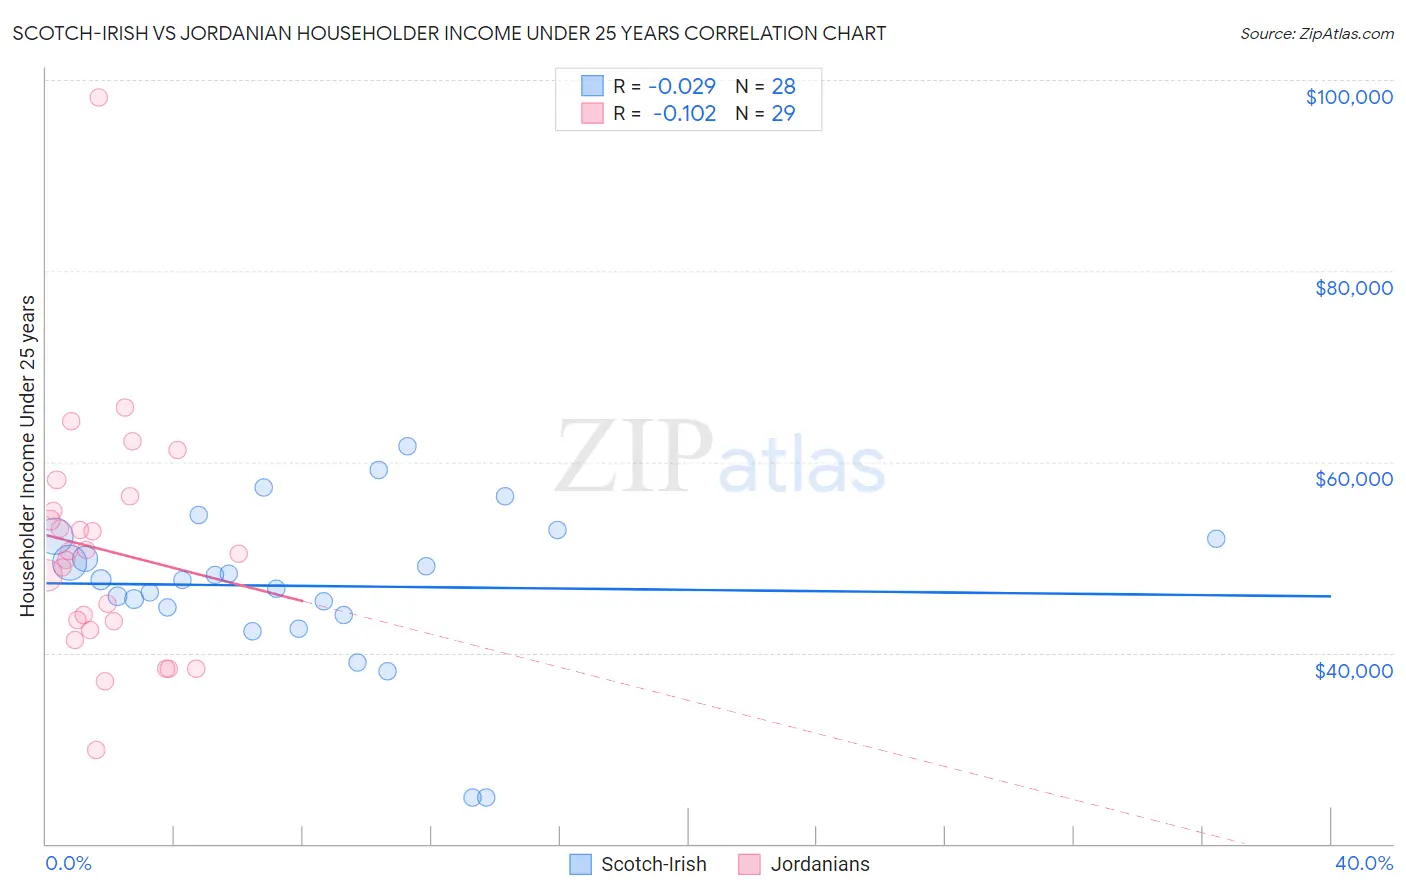
Scotch-Irish vs Jordanian Householder Income Under 25 years Correlation Chart
The statistical analysis conducted on geographies consisting of 427,674,236 people shows no correlation between the proportion of Scotch-Irish and household income with householder under the age of 25 in the United States with a correlation coefficient (R) of -0.029 and weighted average of $49,039. Similarly, the statistical analysis conducted on geographies consisting of 151,351,100 people shows a poor negative correlation between the proportion of Jordanians and household income with householder under the age of 25 in the United States with a correlation coefficient (R) of -0.102 and weighted average of $51,796, a difference of 5.6%.
Householder Income Under 25 years Correlation Summary
| Measurement | Scotch-Irish | Jordanian |
| Minimum | $24,821 | $29,848 |
| Maximum | $61,601 | $98,216 |
| Range | $36,780 | $68,368 |
| Mean | $47,004 | $50,808 |
| Median | $47,645 | $50,313 |
| Interquartile 25% (IQ1) | $44,331 | $42,854 |
| Interquartile 75% (IQ3) | $52,103 | $55,629 |
| Interquartile Range (IQR) | $7,772 | $12,776 |
| Standard Deviation (Sample) | $8,411 | $12,639 |
| Standard Deviation (Population) | $8,259 | $12,419 |
Similar Demographics by Householder Income Under 25 years
Demographics Similar to Scotch-Irish by Householder Income Under 25 years
In terms of householder income under 25 years, the demographic groups most similar to Scotch-Irish are French American Indian ($48,977, a difference of 0.13%), Carpatho Rusyn ($49,113, a difference of 0.15%), Senegalese ($48,953, a difference of 0.18%), Liberian ($48,917, a difference of 0.25%), and Immigrants from Nigeria ($49,174, a difference of 0.28%).
| Demographics | Rating | Rank | Householder Income Under 25 years |
| Nigerians | 0.1 /100 | #278 | Tragic $49,416 |
| Apache | 0.1 /100 | #279 | Tragic $49,395 |
| Hmong | 0.1 /100 | #280 | Tragic $49,364 |
| Immigrants | Nonimmigrants | 0.1 /100 | #281 | Tragic $49,348 |
| Alsatians | 0.1 /100 | #282 | Tragic $49,267 |
| Immigrants | Nigeria | 0.1 /100 | #283 | Tragic $49,174 |
| Carpatho Rusyns | 0.1 /100 | #284 | Tragic $49,113 |
| Scotch-Irish | 0.0 /100 | #285 | Tragic $49,039 |
| French American Indians | 0.0 /100 | #286 | Tragic $48,977 |
| Senegalese | 0.0 /100 | #287 | Tragic $48,953 |
| Liberians | 0.0 /100 | #288 | Tragic $48,917 |
| Hondurans | 0.0 /100 | #289 | Tragic $48,885 |
| Americans | 0.0 /100 | #290 | Tragic $48,860 |
| Immigrants | Burma/Myanmar | 0.0 /100 | #291 | Tragic $48,749 |
| Shoshone | 0.0 /100 | #292 | Tragic $48,720 |
Demographics Similar to Jordanians by Householder Income Under 25 years
In terms of householder income under 25 years, the demographic groups most similar to Jordanians are European ($51,796, a difference of 0.0%), Mexican American Indian ($51,783, a difference of 0.030%), Basque ($51,818, a difference of 0.040%), Immigrants from England ($51,817, a difference of 0.040%), and Finnish ($51,827, a difference of 0.060%).
| Demographics | Rating | Rank | Householder Income Under 25 years |
| Immigrants | Zimbabwe | 33.8 /100 | #175 | Fair $51,914 |
| Austrians | 32.9 /100 | #176 | Fair $51,898 |
| British West Indians | 30.0 /100 | #177 | Fair $51,844 |
| Finns | 29.2 /100 | #178 | Fair $51,827 |
| Basques | 28.7 /100 | #179 | Fair $51,818 |
| Immigrants | England | 28.7 /100 | #180 | Fair $51,817 |
| Europeans | 27.6 /100 | #181 | Fair $51,796 |
| Jordanians | 27.6 /100 | #182 | Fair $51,796 |
| Mexican American Indians | 27.0 /100 | #183 | Fair $51,783 |
| Paiute | 25.1 /100 | #184 | Fair $51,743 |
| Immigrants | Latvia | 24.8 /100 | #185 | Fair $51,737 |
| Alaskan Athabascans | 23.8 /100 | #186 | Fair $51,713 |
| Immigrants | South Africa | 23.4 /100 | #187 | Fair $51,705 |
| Northern Europeans | 22.2 /100 | #188 | Fair $51,678 |
| Croatians | 21.6 /100 | #189 | Fair $51,662 |