Crow vs Jordanian Householder Income Over 65 years
COMPARE
Crow
Jordanian
Householder Income Over 65 years
Householder Income Over 65 years Comparison
Crow
Jordanians
$49,234
HOUSEHOLDER INCOME OVER 65 YEARS
0.0/ 100
METRIC RATING
335th/ 347
METRIC RANK
$64,313
HOUSEHOLDER INCOME OVER 65 YEARS
97.1/ 100
METRIC RATING
93rd/ 347
METRIC RANK
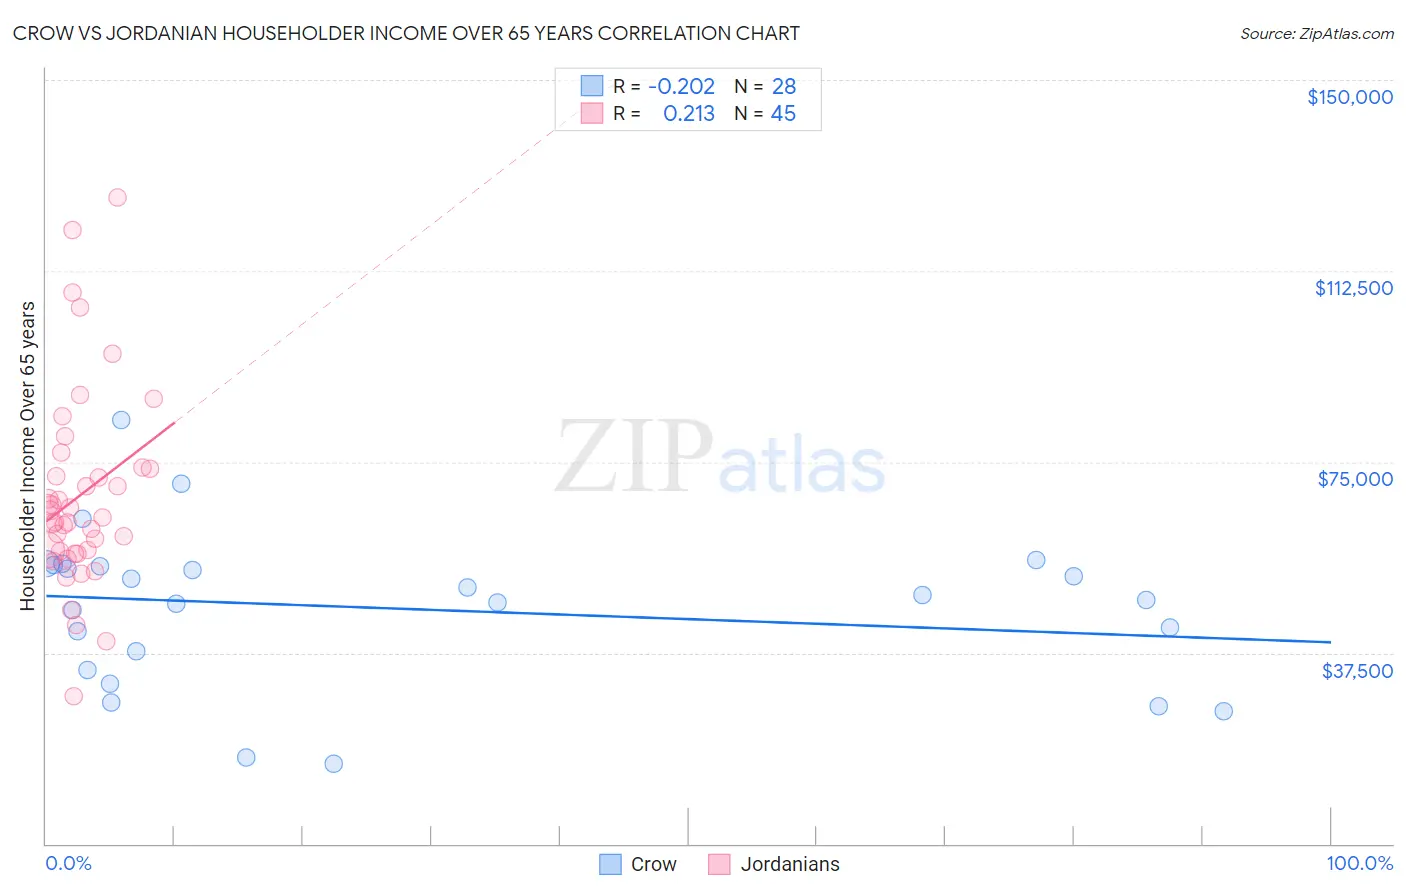
Crow vs Jordanian Householder Income Over 65 years Correlation Chart
The statistical analysis conducted on geographies consisting of 59,087,970 people shows a weak negative correlation between the proportion of Crow and household income with householder over the age of 65 in the United States with a correlation coefficient (R) of -0.202 and weighted average of $49,234. Similarly, the statistical analysis conducted on geographies consisting of 166,252,116 people shows a weak positive correlation between the proportion of Jordanians and household income with householder over the age of 65 in the United States with a correlation coefficient (R) of 0.213 and weighted average of $64,313, a difference of 30.6%.
Householder Income Over 65 years Correlation Summary
| Measurement | Crow | Jordanian |
| Minimum | $15,714 | $29,063 |
| Maximum | $83,321 | $126,912 |
| Range | $67,607 | $97,849 |
| Mean | $46,192 | $68,423 |
| Median | $48,334 | $64,083 |
| Interquartile 25% (IQ1) | $35,989 | $57,185 |
| Interquartile 75% (IQ3) | $54,581 | $73,869 |
| Interquartile Range (IQR) | $18,592 | $16,684 |
| Standard Deviation (Sample) | $15,233 | $19,490 |
| Standard Deviation (Population) | $14,959 | $19,273 |
Similar Demographics by Householder Income Over 65 years
Demographics Similar to Crow by Householder Income Over 65 years
In terms of householder income over 65 years, the demographic groups most similar to Crow are Cuban ($49,152, a difference of 0.17%), Tohono O'odham ($49,121, a difference of 0.23%), Immigrants from Caribbean ($48,535, a difference of 1.4%), Immigrants from Dominica ($50,071, a difference of 1.7%), and Cape Verdean ($50,077, a difference of 1.7%).
| Demographics | Rating | Rank | Householder Income Over 65 years |
| Hopi | 0.0 /100 | #328 | Tragic $50,925 |
| Blacks/African Americans | 0.0 /100 | #329 | Tragic $50,779 |
| Immigrants | Grenada | 0.0 /100 | #330 | Tragic $50,747 |
| Pima | 0.0 /100 | #331 | Tragic $50,539 |
| Dutch West Indians | 0.0 /100 | #332 | Tragic $50,475 |
| Cape Verdeans | 0.0 /100 | #333 | Tragic $50,077 |
| Immigrants | Dominica | 0.0 /100 | #334 | Tragic $50,071 |
| Crow | 0.0 /100 | #335 | Tragic $49,234 |
| Cubans | 0.0 /100 | #336 | Tragic $49,152 |
| Tohono O'odham | 0.0 /100 | #337 | Tragic $49,121 |
| Immigrants | Caribbean | 0.0 /100 | #338 | Tragic $48,535 |
| Navajo | 0.0 /100 | #339 | Tragic $47,722 |
| Immigrants | Yemen | 0.0 /100 | #340 | Tragic $47,527 |
| Dominicans | 0.0 /100 | #341 | Tragic $46,964 |
| Immigrants | Cabo Verde | 0.0 /100 | #342 | Tragic $46,654 |
Demographics Similar to Jordanians by Householder Income Over 65 years
In terms of householder income over 65 years, the demographic groups most similar to Jordanians are Immigrants from Egypt ($64,299, a difference of 0.020%), Immigrants from Latvia ($64,298, a difference of 0.020%), Immigrants from Hungary ($64,277, a difference of 0.060%), Immigrants from Bulgaria ($64,379, a difference of 0.10%), and Immigrants from Oceania ($64,416, a difference of 0.16%).
| Demographics | Rating | Rank | Householder Income Over 65 years |
| Immigrants | Russia | 97.6 /100 | #86 | Exceptional $64,512 |
| Austrians | 97.5 /100 | #87 | Exceptional $64,470 |
| Immigrants | Romania | 97.5 /100 | #88 | Exceptional $64,462 |
| Paraguayans | 97.4 /100 | #89 | Exceptional $64,443 |
| Immigrants | Kuwait | 97.4 /100 | #90 | Exceptional $64,433 |
| Immigrants | Oceania | 97.4 /100 | #91 | Exceptional $64,416 |
| Immigrants | Bulgaria | 97.3 /100 | #92 | Exceptional $64,379 |
| Jordanians | 97.1 /100 | #93 | Exceptional $64,313 |
| Immigrants | Egypt | 97.0 /100 | #94 | Exceptional $64,299 |
| Immigrants | Latvia | 97.0 /100 | #95 | Exceptional $64,298 |
| Immigrants | Hungary | 97.0 /100 | #96 | Exceptional $64,277 |
| Sri Lankans | 96.7 /100 | #97 | Exceptional $64,201 |
| Romanians | 96.5 /100 | #98 | Exceptional $64,142 |
| Assyrians/Chaldeans/Syriacs | 96.4 /100 | #99 | Exceptional $64,108 |
| Immigrants | South Eastern Asia | 96.3 /100 | #100 | Exceptional $64,089 |