Immigrants from North Macedonia vs Jordanian Householder Income Over 65 years
COMPARE
Immigrants from North Macedonia
Jordanian
Householder Income Over 65 years
Householder Income Over 65 years Comparison
Immigrants from North Macedonia
Jordanians
$61,175
HOUSEHOLDER INCOME OVER 65 YEARS
55.4/ 100
METRIC RATING
164th/ 347
METRIC RANK
$64,313
HOUSEHOLDER INCOME OVER 65 YEARS
97.1/ 100
METRIC RATING
93rd/ 347
METRIC RANK
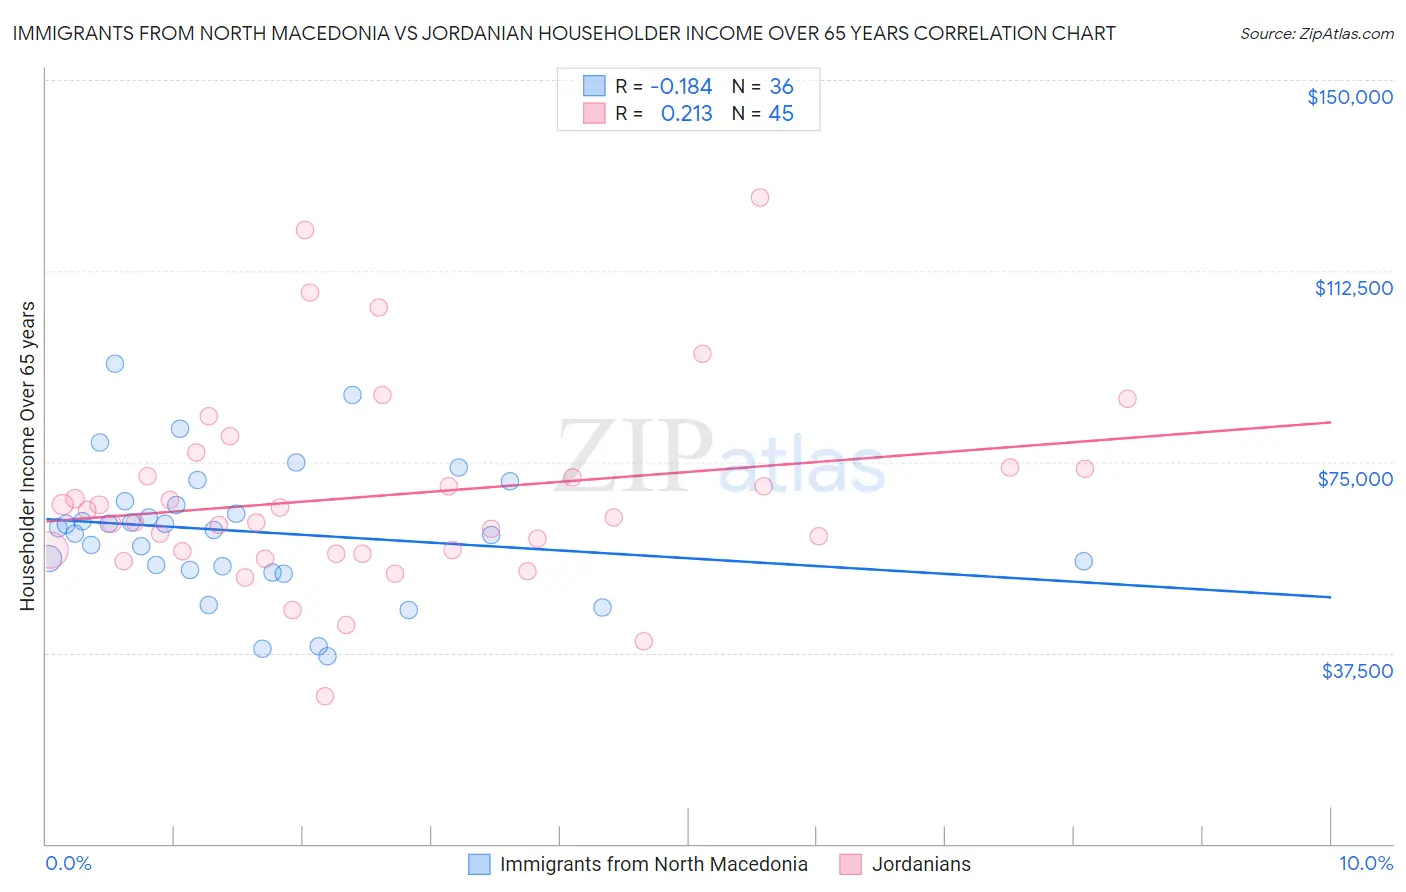
Immigrants from North Macedonia vs Jordanian Householder Income Over 65 years Correlation Chart
The statistical analysis conducted on geographies consisting of 74,241,518 people shows a poor negative correlation between the proportion of Immigrants from North Macedonia and household income with householder over the age of 65 in the United States with a correlation coefficient (R) of -0.184 and weighted average of $61,175. Similarly, the statistical analysis conducted on geographies consisting of 166,252,116 people shows a weak positive correlation between the proportion of Jordanians and household income with householder over the age of 65 in the United States with a correlation coefficient (R) of 0.213 and weighted average of $64,313, a difference of 5.1%.
Householder Income Over 65 years Correlation Summary
| Measurement | Immigrants from North Macedonia | Jordanian |
| Minimum | $36,717 | $29,063 |
| Maximum | $94,385 | $126,912 |
| Range | $57,668 | $97,849 |
| Mean | $61,330 | $68,423 |
| Median | $61,846 | $64,083 |
| Interquartile 25% (IQ1) | $54,077 | $57,185 |
| Interquartile 75% (IQ3) | $66,915 | $73,869 |
| Interquartile Range (IQR) | $12,838 | $16,684 |
| Standard Deviation (Sample) | $12,892 | $19,490 |
| Standard Deviation (Population) | $12,712 | $19,273 |
Similar Demographics by Householder Income Over 65 years
Demographics Similar to Immigrants from North Macedonia by Householder Income Over 65 years
In terms of householder income over 65 years, the demographic groups most similar to Immigrants from North Macedonia are Ugandan ($61,177, a difference of 0.0%), Immigrants from Ukraine ($61,163, a difference of 0.020%), Immigrants from Eastern Africa ($61,157, a difference of 0.030%), Czech ($61,244, a difference of 0.11%), and Norwegian ($61,104, a difference of 0.12%).
| Demographics | Rating | Rank | Householder Income Over 65 years |
| Macedonians | 65.1 /100 | #157 | Good $61,564 |
| English | 63.3 /100 | #158 | Good $61,487 |
| Brazilians | 62.7 /100 | #159 | Good $61,465 |
| Portuguese | 62.1 /100 | #160 | Good $61,440 |
| Icelanders | 57.9 /100 | #161 | Average $61,270 |
| Czechs | 57.2 /100 | #162 | Average $61,244 |
| Ugandans | 55.5 /100 | #163 | Average $61,177 |
| Immigrants | North Macedonia | 55.4 /100 | #164 | Average $61,175 |
| Immigrants | Ukraine | 55.1 /100 | #165 | Average $61,163 |
| Immigrants | Eastern Africa | 55.0 /100 | #166 | Average $61,157 |
| Norwegians | 53.6 /100 | #167 | Average $61,104 |
| Irish | 53.4 /100 | #168 | Average $61,097 |
| Carpatho Rusyns | 53.3 /100 | #169 | Average $61,093 |
| Serbians | 53.1 /100 | #170 | Average $61,087 |
| Inupiat | 52.4 /100 | #171 | Average $61,061 |
Demographics Similar to Jordanians by Householder Income Over 65 years
In terms of householder income over 65 years, the demographic groups most similar to Jordanians are Immigrants from Egypt ($64,299, a difference of 0.020%), Immigrants from Latvia ($64,298, a difference of 0.020%), Immigrants from Hungary ($64,277, a difference of 0.060%), Immigrants from Bulgaria ($64,379, a difference of 0.10%), and Immigrants from Oceania ($64,416, a difference of 0.16%).
| Demographics | Rating | Rank | Householder Income Over 65 years |
| Immigrants | Russia | 97.6 /100 | #86 | Exceptional $64,512 |
| Austrians | 97.5 /100 | #87 | Exceptional $64,470 |
| Immigrants | Romania | 97.5 /100 | #88 | Exceptional $64,462 |
| Paraguayans | 97.4 /100 | #89 | Exceptional $64,443 |
| Immigrants | Kuwait | 97.4 /100 | #90 | Exceptional $64,433 |
| Immigrants | Oceania | 97.4 /100 | #91 | Exceptional $64,416 |
| Immigrants | Bulgaria | 97.3 /100 | #92 | Exceptional $64,379 |
| Jordanians | 97.1 /100 | #93 | Exceptional $64,313 |
| Immigrants | Egypt | 97.0 /100 | #94 | Exceptional $64,299 |
| Immigrants | Latvia | 97.0 /100 | #95 | Exceptional $64,298 |
| Immigrants | Hungary | 97.0 /100 | #96 | Exceptional $64,277 |
| Sri Lankans | 96.7 /100 | #97 | Exceptional $64,201 |
| Romanians | 96.5 /100 | #98 | Exceptional $64,142 |
| Assyrians/Chaldeans/Syriacs | 96.4 /100 | #99 | Exceptional $64,108 |
| Immigrants | South Eastern Asia | 96.3 /100 | #100 | Exceptional $64,089 |