Senegalese vs Jordanian Householder Income Over 65 years
COMPARE
Senegalese
Jordanian
Householder Income Over 65 years
Householder Income Over 65 years Comparison
Senegalese
Jordanians
$53,591
HOUSEHOLDER INCOME OVER 65 YEARS
0.0/ 100
METRIC RATING
294th/ 347
METRIC RANK
$64,313
HOUSEHOLDER INCOME OVER 65 YEARS
97.1/ 100
METRIC RATING
93rd/ 347
METRIC RANK
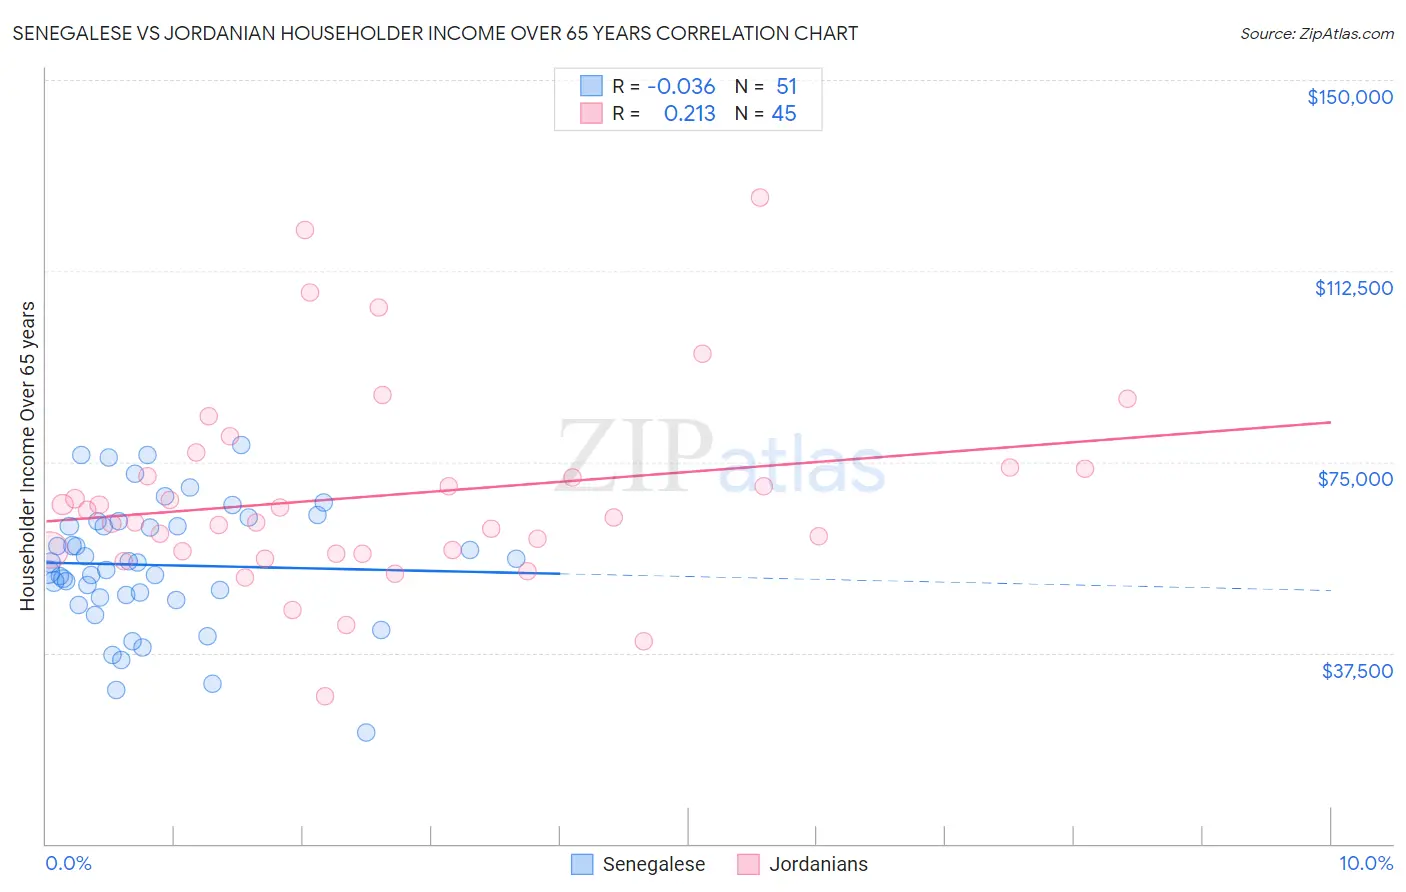
Senegalese vs Jordanian Householder Income Over 65 years Correlation Chart
The statistical analysis conducted on geographies consisting of 78,053,259 people shows no correlation between the proportion of Senegalese and household income with householder over the age of 65 in the United States with a correlation coefficient (R) of -0.036 and weighted average of $53,591. Similarly, the statistical analysis conducted on geographies consisting of 166,252,116 people shows a weak positive correlation between the proportion of Jordanians and household income with householder over the age of 65 in the United States with a correlation coefficient (R) of 0.213 and weighted average of $64,313, a difference of 20.0%.
Householder Income Over 65 years Correlation Summary
| Measurement | Senegalese | Jordanian |
| Minimum | $21,940 | $29,063 |
| Maximum | $78,302 | $126,912 |
| Range | $56,362 | $97,849 |
| Mean | $54,750 | $68,423 |
| Median | $55,203 | $64,083 |
| Interquartile 25% (IQ1) | $48,378 | $57,185 |
| Interquartile 75% (IQ3) | $63,248 | $73,869 |
| Interquartile Range (IQR) | $14,869 | $16,684 |
| Standard Deviation (Sample) | $12,398 | $19,490 |
| Standard Deviation (Population) | $12,276 | $19,273 |
Similar Demographics by Householder Income Over 65 years
Demographics Similar to Senegalese by Householder Income Over 65 years
In terms of householder income over 65 years, the demographic groups most similar to Senegalese are Immigrants from Belize ($53,665, a difference of 0.14%), Shoshone ($53,681, a difference of 0.17%), African ($53,711, a difference of 0.22%), Chickasaw ($53,732, a difference of 0.26%), and Iroquois ($53,737, a difference of 0.27%).
| Demographics | Rating | Rank | Householder Income Over 65 years |
| Immigrants | Barbados | 0.1 /100 | #287 | Tragic $53,766 |
| Paiute | 0.1 /100 | #288 | Tragic $53,762 |
| Iroquois | 0.1 /100 | #289 | Tragic $53,737 |
| Chickasaw | 0.1 /100 | #290 | Tragic $53,732 |
| Africans | 0.0 /100 | #291 | Tragic $53,711 |
| Shoshone | 0.0 /100 | #292 | Tragic $53,681 |
| Immigrants | Belize | 0.0 /100 | #293 | Tragic $53,665 |
| Senegalese | 0.0 /100 | #294 | Tragic $53,591 |
| Immigrants | Central America | 0.0 /100 | #295 | Tragic $53,420 |
| Immigrants | Somalia | 0.0 /100 | #296 | Tragic $53,333 |
| Immigrants | Latin America | 0.0 /100 | #297 | Tragic $53,265 |
| Central American Indians | 0.0 /100 | #298 | Tragic $53,232 |
| Ottawa | 0.0 /100 | #299 | Tragic $53,217 |
| Immigrants | Bahamas | 0.0 /100 | #300 | Tragic $53,174 |
| Yuman | 0.0 /100 | #301 | Tragic $53,110 |
Demographics Similar to Jordanians by Householder Income Over 65 years
In terms of householder income over 65 years, the demographic groups most similar to Jordanians are Immigrants from Egypt ($64,299, a difference of 0.020%), Immigrants from Latvia ($64,298, a difference of 0.020%), Immigrants from Hungary ($64,277, a difference of 0.060%), Immigrants from Bulgaria ($64,379, a difference of 0.10%), and Immigrants from Oceania ($64,416, a difference of 0.16%).
| Demographics | Rating | Rank | Householder Income Over 65 years |
| Immigrants | Russia | 97.6 /100 | #86 | Exceptional $64,512 |
| Austrians | 97.5 /100 | #87 | Exceptional $64,470 |
| Immigrants | Romania | 97.5 /100 | #88 | Exceptional $64,462 |
| Paraguayans | 97.4 /100 | #89 | Exceptional $64,443 |
| Immigrants | Kuwait | 97.4 /100 | #90 | Exceptional $64,433 |
| Immigrants | Oceania | 97.4 /100 | #91 | Exceptional $64,416 |
| Immigrants | Bulgaria | 97.3 /100 | #92 | Exceptional $64,379 |
| Jordanians | 97.1 /100 | #93 | Exceptional $64,313 |
| Immigrants | Egypt | 97.0 /100 | #94 | Exceptional $64,299 |
| Immigrants | Latvia | 97.0 /100 | #95 | Exceptional $64,298 |
| Immigrants | Hungary | 97.0 /100 | #96 | Exceptional $64,277 |
| Sri Lankans | 96.7 /100 | #97 | Exceptional $64,201 |
| Romanians | 96.5 /100 | #98 | Exceptional $64,142 |
| Assyrians/Chaldeans/Syriacs | 96.4 /100 | #99 | Exceptional $64,108 |
| Immigrants | South Eastern Asia | 96.3 /100 | #100 | Exceptional $64,089 |