Subsaharan African vs Brazilian Householder Income Over 65 years
COMPARE
Subsaharan African
Brazilian
Householder Income Over 65 years
Householder Income Over 65 years Comparison
Sub-Saharan Africans
Brazilians
$56,615
HOUSEHOLDER INCOME OVER 65 YEARS
1.0/ 100
METRIC RATING
240th/ 347
METRIC RANK
$61,465
HOUSEHOLDER INCOME OVER 65 YEARS
62.7/ 100
METRIC RATING
159th/ 347
METRIC RANK
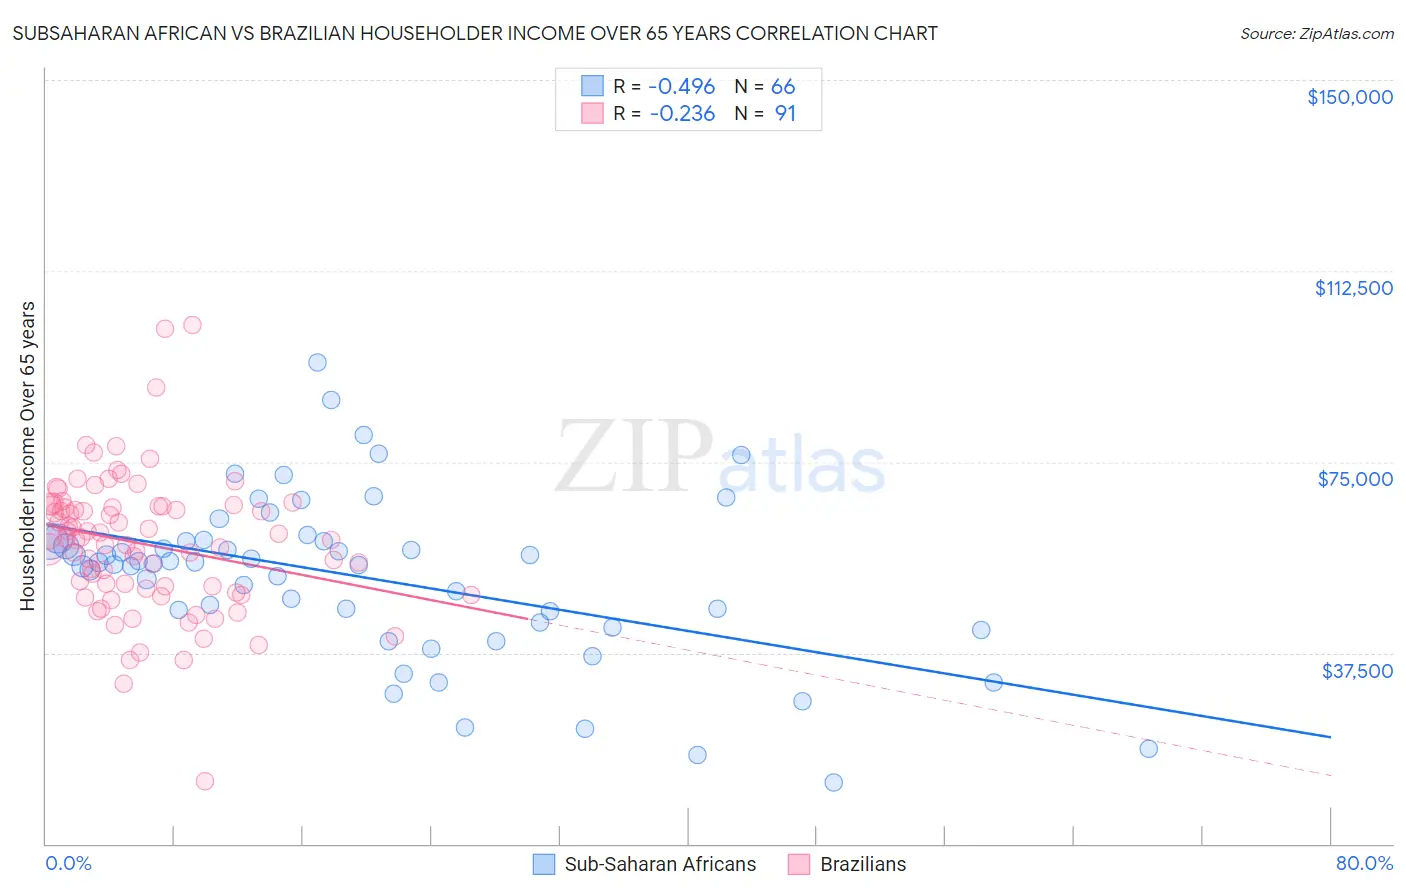
Subsaharan African vs Brazilian Householder Income Over 65 years Correlation Chart
The statistical analysis conducted on geographies consisting of 505,008,485 people shows a moderate negative correlation between the proportion of Sub-Saharan Africans and household income with householder over the age of 65 in the United States with a correlation coefficient (R) of -0.496 and weighted average of $56,615. Similarly, the statistical analysis conducted on geographies consisting of 322,898,345 people shows a weak negative correlation between the proportion of Brazilians and household income with householder over the age of 65 in the United States with a correlation coefficient (R) of -0.236 and weighted average of $61,465, a difference of 8.6%.
Householder Income Over 65 years Correlation Summary
| Measurement | Subsaharan African | Brazilian |
| Minimum | $12,049 | $12,293 |
| Maximum | $94,427 | $101,779 |
| Range | $82,378 | $89,486 |
| Mean | $52,341 | $58,895 |
| Median | $55,146 | $60,037 |
| Interquartile 25% (IQ1) | $43,507 | $50,127 |
| Interquartile 75% (IQ3) | $59,521 | $66,316 |
| Interquartile Range (IQR) | $16,014 | $16,189 |
| Standard Deviation (Sample) | $16,149 | $13,580 |
| Standard Deviation (Population) | $16,026 | $13,505 |
Similar Demographics by Householder Income Over 65 years
Demographics Similar to Sub-Saharan Africans by Householder Income Over 65 years
In terms of householder income over 65 years, the demographic groups most similar to Sub-Saharan Africans are Immigrants from Laos ($56,722, a difference of 0.19%), Immigrants from Guyana ($56,495, a difference of 0.21%), Fijian ($56,768, a difference of 0.27%), Yaqui ($56,417, a difference of 0.35%), and Guyanese ($56,351, a difference of 0.47%).
| Demographics | Rating | Rank | Householder Income Over 65 years |
| Immigrants | Western Africa | 1.7 /100 | #233 | Tragic $57,119 |
| Immigrants | Burma/Myanmar | 1.7 /100 | #234 | Tragic $57,114 |
| Spanish Americans | 1.6 /100 | #235 | Tragic $57,021 |
| Immigrants | Uruguay | 1.5 /100 | #236 | Tragic $56,975 |
| Immigrants | Panama | 1.5 /100 | #237 | Tragic $56,944 |
| Fijians | 1.2 /100 | #238 | Tragic $56,768 |
| Immigrants | Laos | 1.2 /100 | #239 | Tragic $56,722 |
| Sub-Saharan Africans | 1.0 /100 | #240 | Tragic $56,615 |
| Immigrants | Guyana | 0.9 /100 | #241 | Tragic $56,495 |
| Yaqui | 0.8 /100 | #242 | Tragic $56,417 |
| Guyanese | 0.8 /100 | #243 | Tragic $56,351 |
| Hmong | 0.8 /100 | #244 | Tragic $56,339 |
| Immigrants | Uzbekistan | 0.8 /100 | #245 | Tragic $56,331 |
| Central Americans | 0.8 /100 | #246 | Tragic $56,321 |
| Yakama | 0.7 /100 | #247 | Tragic $56,234 |
Demographics Similar to Brazilians by Householder Income Over 65 years
In terms of householder income over 65 years, the demographic groups most similar to Brazilians are English ($61,487, a difference of 0.040%), Portuguese ($61,440, a difference of 0.040%), Macedonian ($61,564, a difference of 0.16%), Scandinavian ($61,586, a difference of 0.20%), and Polish ($61,598, a difference of 0.22%).
| Demographics | Rating | Rank | Householder Income Over 65 years |
| Armenians | 67.3 /100 | #152 | Good $61,656 |
| Costa Ricans | 66.9 /100 | #153 | Good $61,638 |
| Swiss | 66.5 /100 | #154 | Good $61,621 |
| Poles | 65.9 /100 | #155 | Good $61,598 |
| Scandinavians | 65.6 /100 | #156 | Good $61,586 |
| Macedonians | 65.1 /100 | #157 | Good $61,564 |
| English | 63.3 /100 | #158 | Good $61,487 |
| Brazilians | 62.7 /100 | #159 | Good $61,465 |
| Portuguese | 62.1 /100 | #160 | Good $61,440 |
| Icelanders | 57.9 /100 | #161 | Average $61,270 |
| Czechs | 57.2 /100 | #162 | Average $61,244 |
| Ugandans | 55.5 /100 | #163 | Average $61,177 |
| Immigrants | North Macedonia | 55.4 /100 | #164 | Average $61,175 |
| Immigrants | Ukraine | 55.1 /100 | #165 | Average $61,163 |
| Immigrants | Eastern Africa | 55.0 /100 | #166 | Average $61,157 |