Serbian vs Brazilian Householder Income Over 65 years
COMPARE
Serbian
Brazilian
Householder Income Over 65 years
Householder Income Over 65 years Comparison
Serbians
Brazilians
$61,087
HOUSEHOLDER INCOME OVER 65 YEARS
53.1/ 100
METRIC RATING
170th/ 347
METRIC RANK
$61,465
HOUSEHOLDER INCOME OVER 65 YEARS
62.7/ 100
METRIC RATING
159th/ 347
METRIC RANK
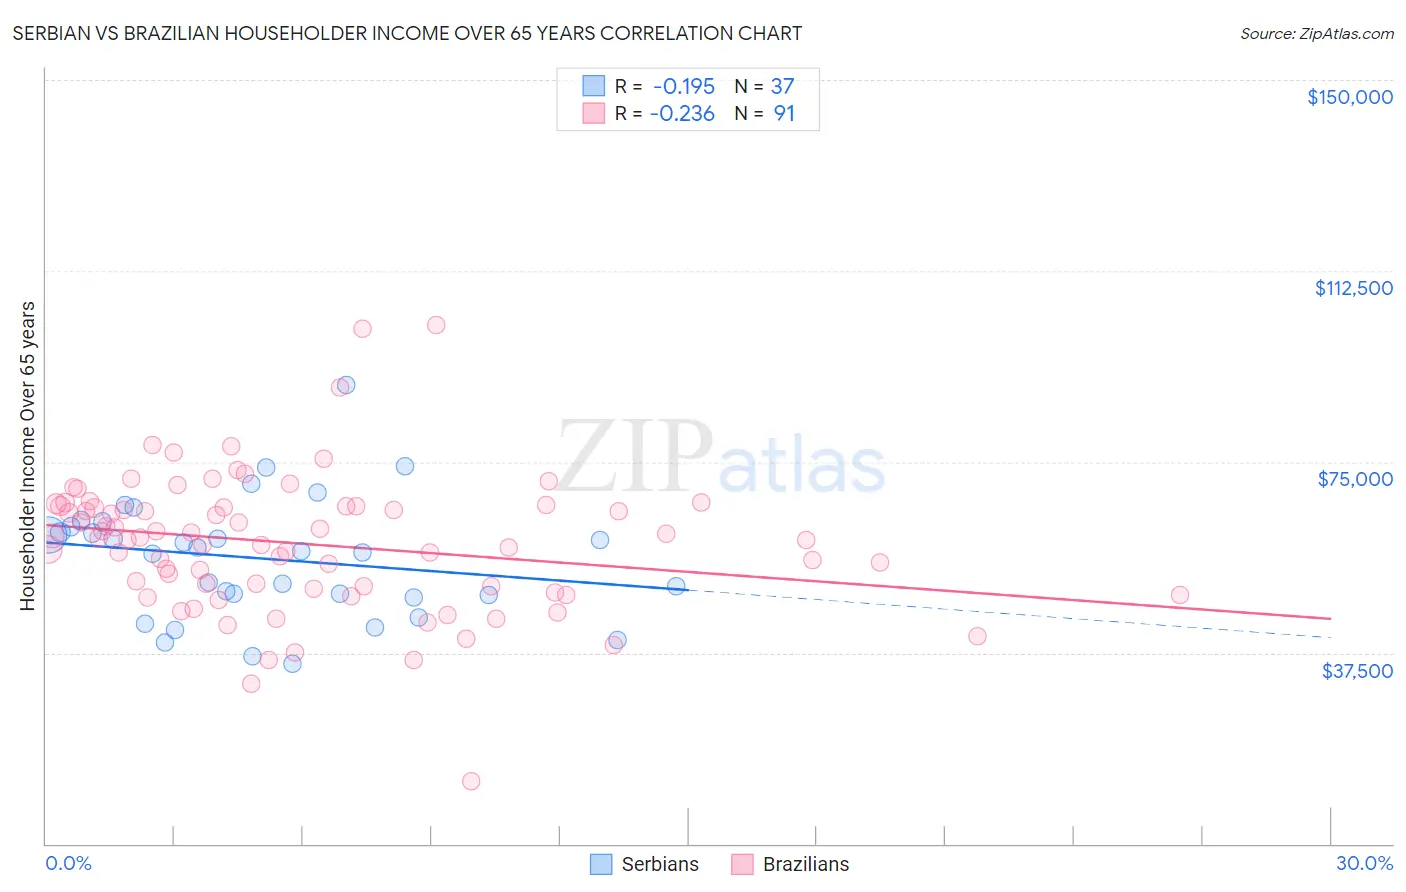
Serbian vs Brazilian Householder Income Over 65 years Correlation Chart
The statistical analysis conducted on geographies consisting of 267,254,398 people shows a poor negative correlation between the proportion of Serbians and household income with householder over the age of 65 in the United States with a correlation coefficient (R) of -0.195 and weighted average of $61,087. Similarly, the statistical analysis conducted on geographies consisting of 322,898,345 people shows a weak negative correlation between the proportion of Brazilians and household income with householder over the age of 65 in the United States with a correlation coefficient (R) of -0.236 and weighted average of $61,465, a difference of 0.62%.
Householder Income Over 65 years Correlation Summary
| Measurement | Serbian | Brazilian |
| Minimum | $35,417 | $12,293 |
| Maximum | $89,997 | $101,779 |
| Range | $54,580 | $89,486 |
| Mean | $56,009 | $58,895 |
| Median | $57,358 | $60,037 |
| Interquartile 25% (IQ1) | $48,698 | $50,127 |
| Interquartile 75% (IQ3) | $62,751 | $66,316 |
| Interquartile Range (IQR) | $14,053 | $16,189 |
| Standard Deviation (Sample) | $11,788 | $13,580 |
| Standard Deviation (Population) | $11,628 | $13,505 |
Demographics Similar to Serbians and Brazilians by Householder Income Over 65 years
In terms of householder income over 65 years, the demographic groups most similar to Serbians are Carpatho Rusyn ($61,093, a difference of 0.010%), Irish ($61,097, a difference of 0.020%), Norwegian ($61,104, a difference of 0.030%), Inupiat ($61,061, a difference of 0.040%), and Immigrants from Poland ($61,041, a difference of 0.080%). Similarly, the demographic groups most similar to Brazilians are English ($61,487, a difference of 0.040%), Portuguese ($61,440, a difference of 0.040%), Macedonian ($61,564, a difference of 0.16%), Scandinavian ($61,586, a difference of 0.20%), and Polish ($61,598, a difference of 0.22%).
| Demographics | Rating | Rank | Householder Income Over 65 years |
| Swiss | 66.5 /100 | #154 | Good $61,621 |
| Poles | 65.9 /100 | #155 | Good $61,598 |
| Scandinavians | 65.6 /100 | #156 | Good $61,586 |
| Macedonians | 65.1 /100 | #157 | Good $61,564 |
| English | 63.3 /100 | #158 | Good $61,487 |
| Brazilians | 62.7 /100 | #159 | Good $61,465 |
| Portuguese | 62.1 /100 | #160 | Good $61,440 |
| Icelanders | 57.9 /100 | #161 | Average $61,270 |
| Czechs | 57.2 /100 | #162 | Average $61,244 |
| Ugandans | 55.5 /100 | #163 | Average $61,177 |
| Immigrants | North Macedonia | 55.4 /100 | #164 | Average $61,175 |
| Immigrants | Ukraine | 55.1 /100 | #165 | Average $61,163 |
| Immigrants | Eastern Africa | 55.0 /100 | #166 | Average $61,157 |
| Norwegians | 53.6 /100 | #167 | Average $61,104 |
| Irish | 53.4 /100 | #168 | Average $61,097 |
| Carpatho Rusyns | 53.3 /100 | #169 | Average $61,093 |
| Serbians | 53.1 /100 | #170 | Average $61,087 |
| Inupiat | 52.4 /100 | #171 | Average $61,061 |
| Immigrants | Poland | 51.9 /100 | #172 | Average $61,041 |
| Immigrants | Micronesia | 50.8 /100 | #173 | Average $61,000 |
| Luxembourgers | 50.0 /100 | #174 | Average $60,967 |