Scotch-Irish vs Brazilian Median Family Income
COMPARE
Scotch-Irish
Brazilian
Median Family Income
Median Family Income Comparison
Scotch-Irish
Brazilians
$99,591
MEDIAN FAMILY INCOME
17.1/ 100
METRIC RATING
203rd/ 347
METRIC RANK
$106,942
MEDIAN FAMILY INCOME
89.8/ 100
METRIC RATING
130th/ 347
METRIC RANK
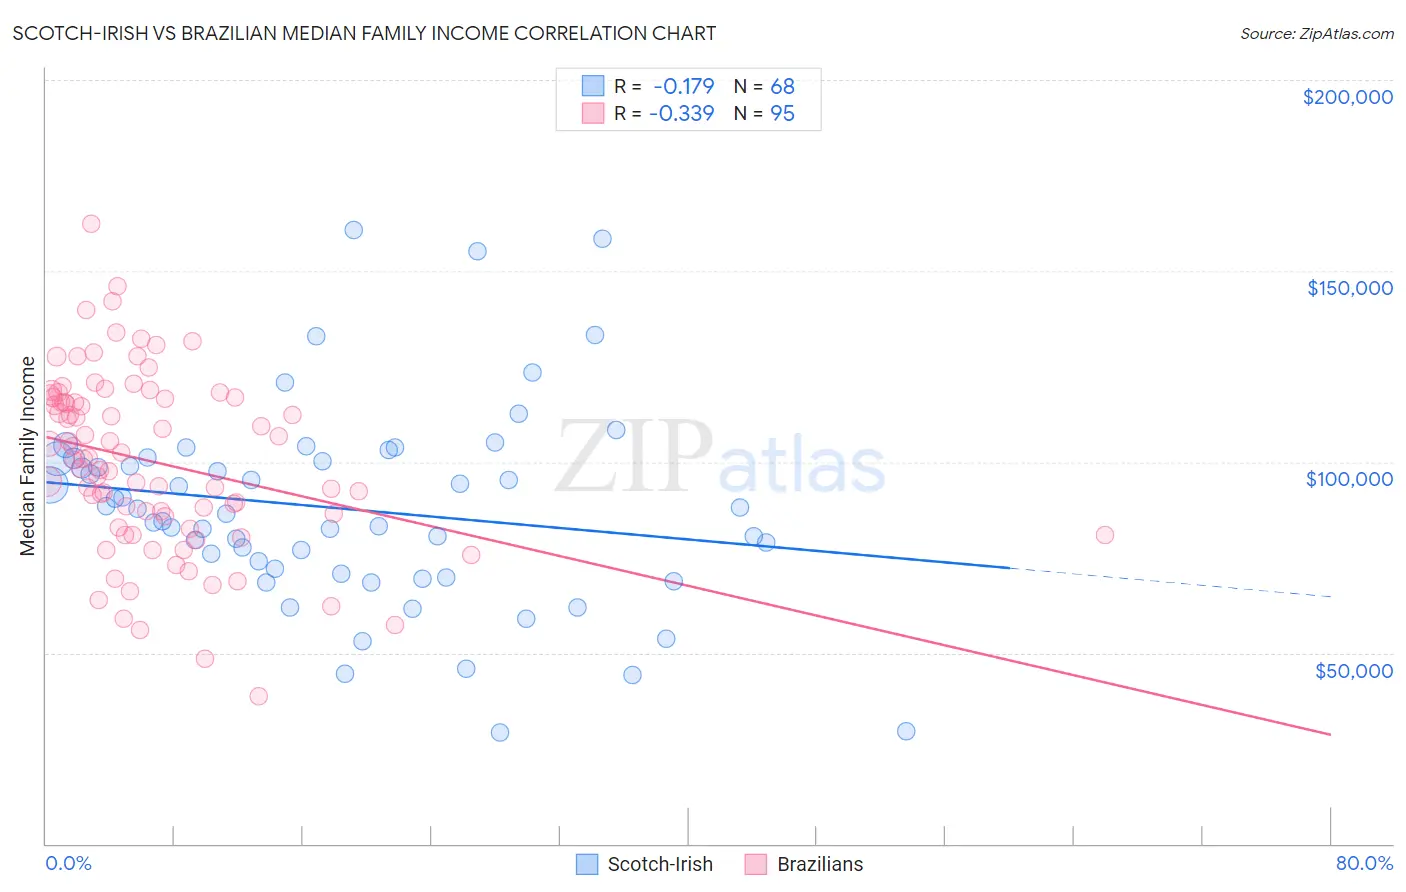
Scotch-Irish vs Brazilian Median Family Income Correlation Chart
The statistical analysis conducted on geographies consisting of 547,821,252 people shows a poor negative correlation between the proportion of Scotch-Irish and median family income in the United States with a correlation coefficient (R) of -0.179 and weighted average of $99,591. Similarly, the statistical analysis conducted on geographies consisting of 323,618,722 people shows a mild negative correlation between the proportion of Brazilians and median family income in the United States with a correlation coefficient (R) of -0.339 and weighted average of $106,942, a difference of 7.4%.
Median Family Income Correlation Summary
| Measurement | Scotch-Irish | Brazilian |
| Minimum | $29,091 | $38,641 |
| Maximum | $160,619 | $162,465 |
| Range | $131,528 | $123,824 |
| Mean | $87,675 | $99,932 |
| Median | $87,122 | $100,863 |
| Interquartile 25% (IQ1) | $71,348 | $82,900 |
| Interquartile 75% (IQ3) | $100,856 | $116,816 |
| Interquartile Range (IQR) | $29,508 | $33,916 |
| Standard Deviation (Sample) | $26,299 | $23,225 |
| Standard Deviation (Population) | $26,105 | $23,102 |
Similar Demographics by Median Family Income
Demographics Similar to Scotch-Irish by Median Family Income
In terms of median family income, the demographic groups most similar to Scotch-Irish are White/Caucasian ($99,800, a difference of 0.21%), Immigrants from Thailand ($99,840, a difference of 0.25%), Spanish ($99,977, a difference of 0.39%), Yugoslavian ($100,119, a difference of 0.53%), and Immigrants from Africa ($100,256, a difference of 0.67%).
| Demographics | Rating | Rank | Median Family Income |
| Samoans | 23.3 /100 | #196 | Fair $100,344 |
| Immigrants | Cameroon | 22.8 /100 | #197 | Fair $100,289 |
| Immigrants | Africa | 22.5 /100 | #198 | Fair $100,256 |
| Yugoslavians | 21.3 /100 | #199 | Fair $100,119 |
| Spanish | 20.1 /100 | #200 | Fair $99,977 |
| Immigrants | Thailand | 19.0 /100 | #201 | Poor $99,840 |
| Whites/Caucasians | 18.7 /100 | #202 | Poor $99,800 |
| Scotch-Irish | 17.1 /100 | #203 | Poor $99,591 |
| Ghanaians | 12.6 /100 | #204 | Poor $98,877 |
| Hawaiians | 12.5 /100 | #205 | Poor $98,869 |
| Immigrants | Iraq | 12.1 /100 | #206 | Poor $98,786 |
| Aleuts | 11.6 /100 | #207 | Poor $98,702 |
| Immigrants | Uruguay | 9.2 /100 | #208 | Tragic $98,205 |
| Immigrants | Colombia | 8.7 /100 | #209 | Tragic $98,067 |
| Puget Sound Salish | 8.2 /100 | #210 | Tragic $97,958 |
Demographics Similar to Brazilians by Median Family Income
In terms of median family income, the demographic groups most similar to Brazilians are Arab ($106,952, a difference of 0.010%), Immigrants from Ethiopia ($106,969, a difference of 0.030%), Lebanese ($107,086, a difference of 0.13%), Serbian ($107,157, a difference of 0.20%), and Canadian ($106,597, a difference of 0.32%).
| Demographics | Rating | Rank | Median Family Income |
| Carpatho Rusyns | 92.2 /100 | #123 | Exceptional $107,502 |
| Pakistanis | 91.7 /100 | #124 | Exceptional $107,390 |
| Taiwanese | 91.4 /100 | #125 | Exceptional $107,295 |
| Serbians | 90.8 /100 | #126 | Exceptional $107,157 |
| Lebanese | 90.5 /100 | #127 | Exceptional $107,086 |
| Immigrants | Ethiopia | 90.0 /100 | #128 | Excellent $106,969 |
| Arabs | 89.9 /100 | #129 | Excellent $106,952 |
| Brazilians | 89.8 /100 | #130 | Excellent $106,942 |
| Canadians | 88.1 /100 | #131 | Excellent $106,597 |
| Immigrants | Fiji | 87.8 /100 | #132 | Excellent $106,544 |
| Ugandans | 87.8 /100 | #133 | Excellent $106,541 |
| Immigrants | Oceania | 87.3 /100 | #134 | Excellent $106,453 |
| Portuguese | 86.3 /100 | #135 | Excellent $106,286 |
| Immigrants | South Eastern Asia | 86.1 /100 | #136 | Excellent $106,252 |
| Immigrants | Uganda | 85.7 /100 | #137 | Excellent $106,188 |