Assyrian/Chaldean/Syriac vs Basque Householder Income Over 65 years
COMPARE
Assyrian/Chaldean/Syriac
Basque
Householder Income Over 65 years
Householder Income Over 65 years Comparison
Assyrians/Chaldeans/Syriacs
Basques
$64,108
HOUSEHOLDER INCOME OVER 65 YEARS
96.4/ 100
METRIC RATING
99th/ 347
METRIC RANK
$62,653
HOUSEHOLDER INCOME OVER 65 YEARS
85.4/ 100
METRIC RATING
130th/ 347
METRIC RANK
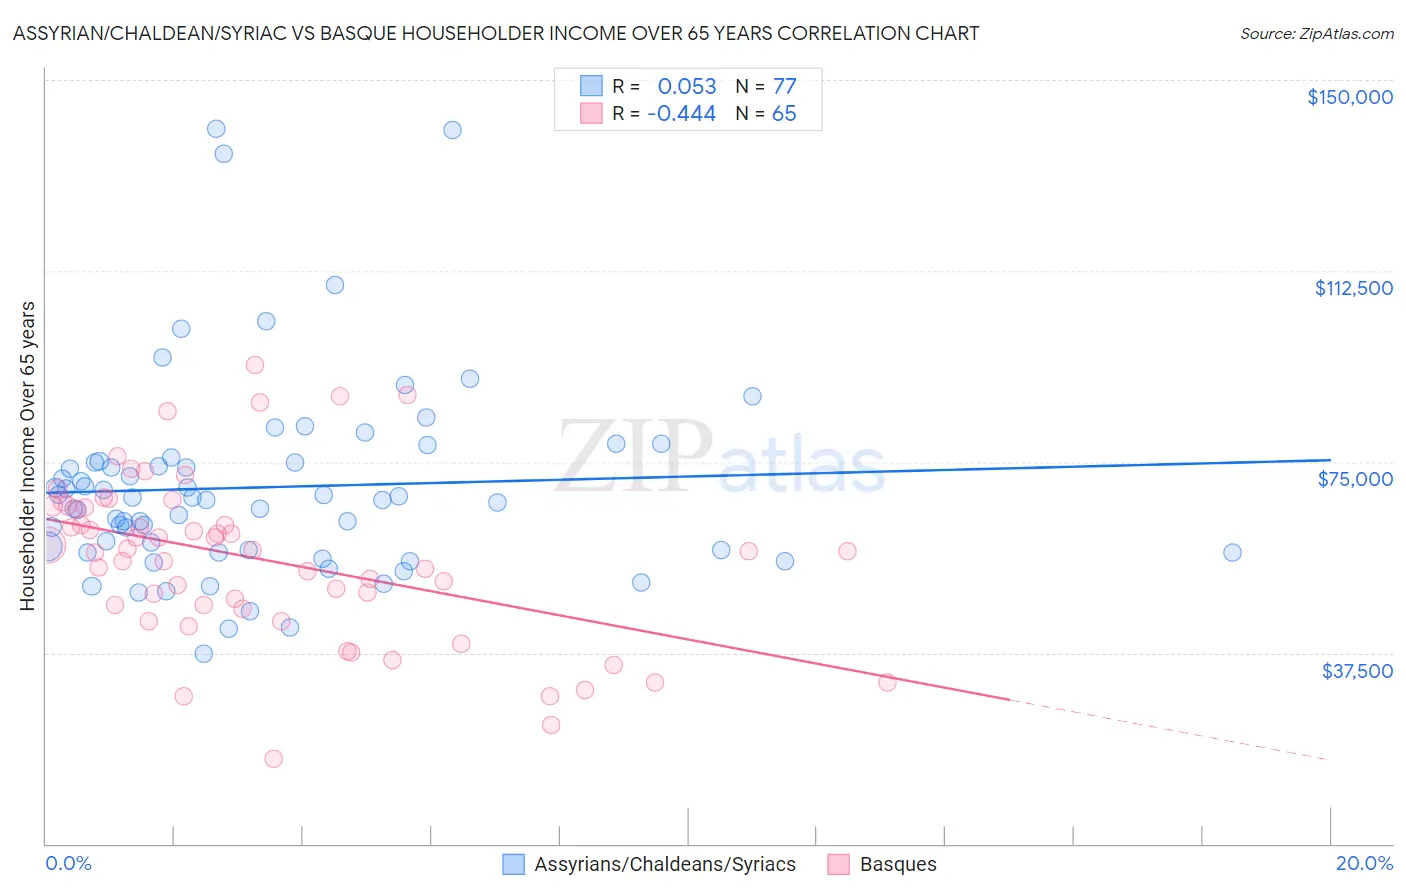
Assyrian/Chaldean/Syriac vs Basque Householder Income Over 65 years Correlation Chart
The statistical analysis conducted on geographies consisting of 110,223,664 people shows a slight positive correlation between the proportion of Assyrians/Chaldeans/Syriacs and household income with householder over the age of 65 in the United States with a correlation coefficient (R) of 0.053 and weighted average of $64,108. Similarly, the statistical analysis conducted on geographies consisting of 165,583,325 people shows a moderate negative correlation between the proportion of Basques and household income with householder over the age of 65 in the United States with a correlation coefficient (R) of -0.444 and weighted average of $62,653, a difference of 2.3%.
Householder Income Over 65 years Correlation Summary
| Measurement | Assyrian/Chaldean/Syriac | Basque |
| Minimum | $37,310 | $16,667 |
| Maximum | $140,431 | $94,125 |
| Range | $103,121 | $77,458 |
| Mean | $70,014 | $55,918 |
| Median | $67,459 | $57,500 |
| Interquartile 25% (IQ1) | $57,422 | $46,469 |
| Interquartile 75% (IQ3) | $75,038 | $66,222 |
| Interquartile Range (IQR) | $17,616 | $19,753 |
| Standard Deviation (Sample) | $19,596 | $16,196 |
| Standard Deviation (Population) | $19,468 | $16,071 |
Similar Demographics by Householder Income Over 65 years
Demographics Similar to Assyrians/Chaldeans/Syriacs by Householder Income Over 65 years
In terms of householder income over 65 years, the demographic groups most similar to Assyrians/Chaldeans/Syriacs are Immigrants from South Eastern Asia ($64,089, a difference of 0.030%), Romanian ($64,142, a difference of 0.050%), Immigrants from Italy ($64,065, a difference of 0.070%), Sri Lankan ($64,201, a difference of 0.14%), and Chilean ($63,957, a difference of 0.24%).
| Demographics | Rating | Rank | Householder Income Over 65 years |
| Immigrants | Bulgaria | 97.3 /100 | #92 | Exceptional $64,379 |
| Jordanians | 97.1 /100 | #93 | Exceptional $64,313 |
| Immigrants | Egypt | 97.0 /100 | #94 | Exceptional $64,299 |
| Immigrants | Latvia | 97.0 /100 | #95 | Exceptional $64,298 |
| Immigrants | Hungary | 97.0 /100 | #96 | Exceptional $64,277 |
| Sri Lankans | 96.7 /100 | #97 | Exceptional $64,201 |
| Romanians | 96.5 /100 | #98 | Exceptional $64,142 |
| Assyrians/Chaldeans/Syriacs | 96.4 /100 | #99 | Exceptional $64,108 |
| Immigrants | South Eastern Asia | 96.3 /100 | #100 | Exceptional $64,089 |
| Immigrants | Italy | 96.2 /100 | #101 | Exceptional $64,065 |
| Chileans | 95.8 /100 | #102 | Exceptional $63,957 |
| British | 95.7 /100 | #103 | Exceptional $63,940 |
| Immigrants | Cameroon | 95.6 /100 | #104 | Exceptional $63,907 |
| Italians | 95.5 /100 | #105 | Exceptional $63,885 |
| Immigrants | Argentina | 95.5 /100 | #106 | Exceptional $63,885 |
Demographics Similar to Basques by Householder Income Over 65 years
In terms of householder income over 65 years, the demographic groups most similar to Basques are Immigrants from Western Asia ($62,645, a difference of 0.010%), Immigrants from Eastern Europe ($62,693, a difference of 0.060%), Aleut ($62,708, a difference of 0.090%), Swedish ($62,736, a difference of 0.13%), and Immigrants from Germany ($62,544, a difference of 0.17%).
| Demographics | Rating | Rank | Householder Income Over 65 years |
| Tlingit-Haida | 88.6 /100 | #123 | Excellent $62,922 |
| Taiwanese | 88.3 /100 | #124 | Excellent $62,894 |
| Soviet Union | 87.8 /100 | #125 | Excellent $62,848 |
| Peruvians | 86.8 /100 | #126 | Excellent $62,766 |
| Swedes | 86.4 /100 | #127 | Excellent $62,736 |
| Aleuts | 86.1 /100 | #128 | Excellent $62,708 |
| Immigrants | Eastern Europe | 85.9 /100 | #129 | Excellent $62,693 |
| Basques | 85.4 /100 | #130 | Excellent $62,653 |
| Immigrants | Western Asia | 85.3 /100 | #131 | Excellent $62,645 |
| Immigrants | Germany | 83.9 /100 | #132 | Excellent $62,544 |
| Immigrants | Northern Africa | 83.6 /100 | #133 | Excellent $62,522 |
| Immigrants | Brazil | 81.2 /100 | #134 | Excellent $62,364 |
| Immigrants | Chile | 81.0 /100 | #135 | Excellent $62,354 |
| Alaskan Athabascans | 80.6 /100 | #136 | Excellent $62,330 |
| Immigrants | Syria | 80.2 /100 | #137 | Excellent $62,303 |