Native/Alaskan vs Basque Householder Income Over 65 years
COMPARE
Native/Alaskan
Basque
Householder Income Over 65 years
Householder Income Over 65 years Comparison
Natives/Alaskans
Basques
$52,081
HOUSEHOLDER INCOME OVER 65 YEARS
0.0/ 100
METRIC RATING
314th/ 347
METRIC RANK
$62,653
HOUSEHOLDER INCOME OVER 65 YEARS
85.4/ 100
METRIC RATING
130th/ 347
METRIC RANK
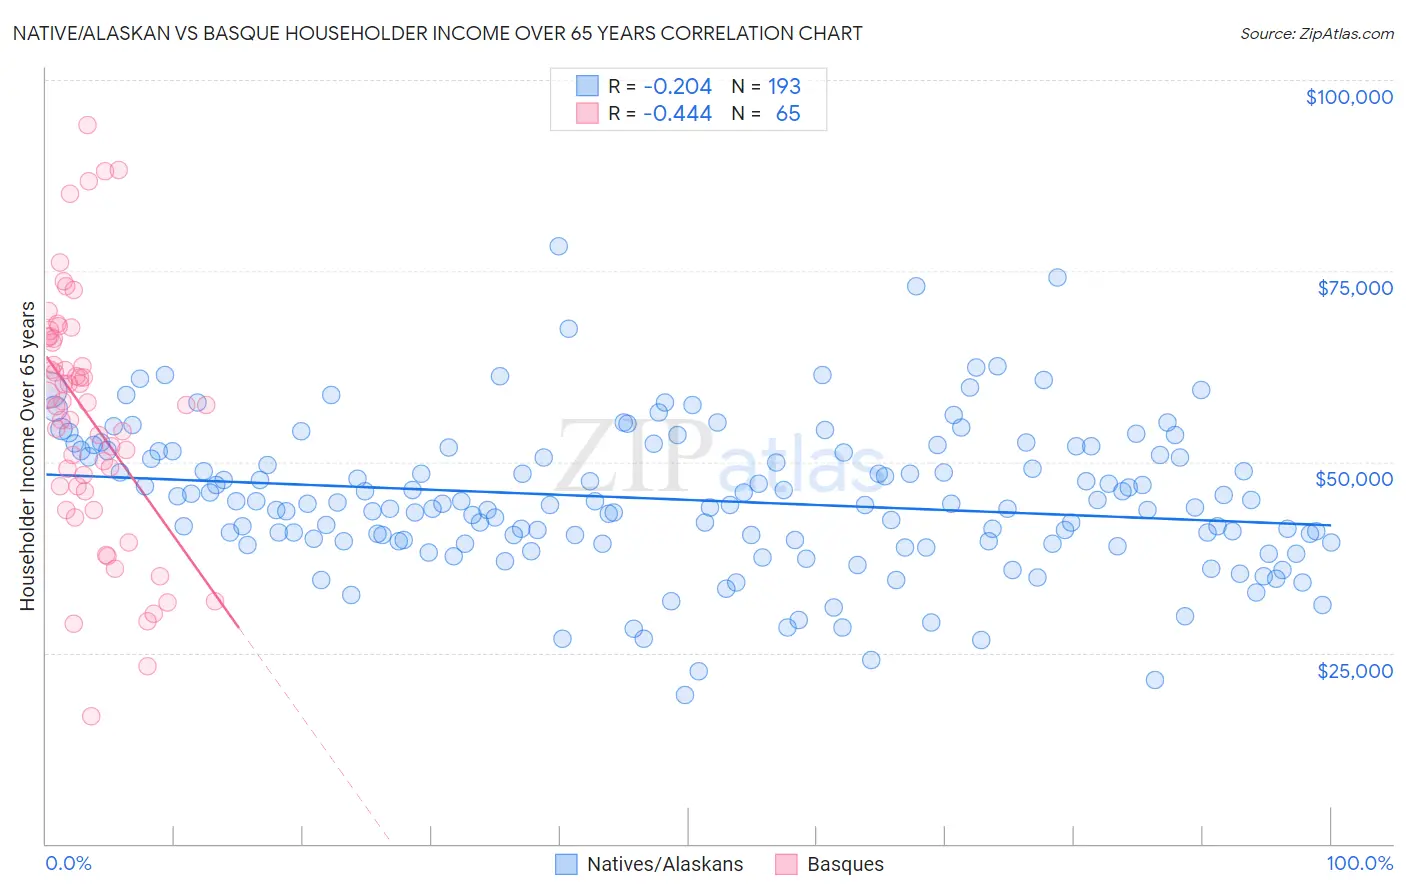
Native/Alaskan vs Basque Householder Income Over 65 years Correlation Chart
The statistical analysis conducted on geographies consisting of 509,572,105 people shows a weak negative correlation between the proportion of Natives/Alaskans and household income with householder over the age of 65 in the United States with a correlation coefficient (R) of -0.204 and weighted average of $52,081. Similarly, the statistical analysis conducted on geographies consisting of 165,583,325 people shows a moderate negative correlation between the proportion of Basques and household income with householder over the age of 65 in the United States with a correlation coefficient (R) of -0.444 and weighted average of $62,653, a difference of 20.3%.
Householder Income Over 65 years Correlation Summary
| Measurement | Native/Alaskan | Basque |
| Minimum | $19,554 | $16,667 |
| Maximum | $78,193 | $94,125 |
| Range | $58,639 | $77,458 |
| Mean | $45,041 | $55,918 |
| Median | $44,466 | $57,500 |
| Interquartile 25% (IQ1) | $39,545 | $46,469 |
| Interquartile 75% (IQ3) | $51,398 | $66,222 |
| Interquartile Range (IQR) | $11,852 | $19,753 |
| Standard Deviation (Sample) | $9,551 | $16,196 |
| Standard Deviation (Population) | $9,526 | $16,071 |
Similar Demographics by Householder Income Over 65 years
Demographics Similar to Natives/Alaskans by Householder Income Over 65 years
In terms of householder income over 65 years, the demographic groups most similar to Natives/Alaskans are Immigrants from Nicaragua ($52,085, a difference of 0.010%), U.S. Virgin Islander ($52,072, a difference of 0.020%), Immigrants from the Azores ($52,121, a difference of 0.080%), Creek ($51,949, a difference of 0.25%), and Immigrants from St. Vincent and the Grenadines ($51,922, a difference of 0.30%).
| Demographics | Rating | Rank | Householder Income Over 65 years |
| Hispanics or Latinos | 0.0 /100 | #307 | Tragic $52,832 |
| Immigrants | Mexico | 0.0 /100 | #308 | Tragic $52,801 |
| Hondurans | 0.0 /100 | #309 | Tragic $52,634 |
| Sioux | 0.0 /100 | #310 | Tragic $52,509 |
| Seminole | 0.0 /100 | #311 | Tragic $52,373 |
| Immigrants | Azores | 0.0 /100 | #312 | Tragic $52,121 |
| Immigrants | Nicaragua | 0.0 /100 | #313 | Tragic $52,085 |
| Natives/Alaskans | 0.0 /100 | #314 | Tragic $52,081 |
| U.S. Virgin Islanders | 0.0 /100 | #315 | Tragic $52,072 |
| Creek | 0.0 /100 | #316 | Tragic $51,949 |
| Immigrants | St. Vincent and the Grenadines | 0.0 /100 | #317 | Tragic $51,922 |
| Haitians | 0.0 /100 | #318 | Tragic $51,912 |
| Immigrants | Honduras | 0.0 /100 | #319 | Tragic $51,888 |
| Colville | 0.0 /100 | #320 | Tragic $51,739 |
| Menominee | 0.0 /100 | #321 | Tragic $51,719 |
Demographics Similar to Basques by Householder Income Over 65 years
In terms of householder income over 65 years, the demographic groups most similar to Basques are Immigrants from Western Asia ($62,645, a difference of 0.010%), Immigrants from Eastern Europe ($62,693, a difference of 0.060%), Aleut ($62,708, a difference of 0.090%), Swedish ($62,736, a difference of 0.13%), and Immigrants from Germany ($62,544, a difference of 0.17%).
| Demographics | Rating | Rank | Householder Income Over 65 years |
| Tlingit-Haida | 88.6 /100 | #123 | Excellent $62,922 |
| Taiwanese | 88.3 /100 | #124 | Excellent $62,894 |
| Soviet Union | 87.8 /100 | #125 | Excellent $62,848 |
| Peruvians | 86.8 /100 | #126 | Excellent $62,766 |
| Swedes | 86.4 /100 | #127 | Excellent $62,736 |
| Aleuts | 86.1 /100 | #128 | Excellent $62,708 |
| Immigrants | Eastern Europe | 85.9 /100 | #129 | Excellent $62,693 |
| Basques | 85.4 /100 | #130 | Excellent $62,653 |
| Immigrants | Western Asia | 85.3 /100 | #131 | Excellent $62,645 |
| Immigrants | Germany | 83.9 /100 | #132 | Excellent $62,544 |
| Immigrants | Northern Africa | 83.6 /100 | #133 | Excellent $62,522 |
| Immigrants | Brazil | 81.2 /100 | #134 | Excellent $62,364 |
| Immigrants | Chile | 81.0 /100 | #135 | Excellent $62,354 |
| Alaskan Athabascans | 80.6 /100 | #136 | Excellent $62,330 |
| Immigrants | Syria | 80.2 /100 | #137 | Excellent $62,303 |