Slavic vs Basque Householder Income Over 65 years
COMPARE
Slavic
Basque
Householder Income Over 65 years
Householder Income Over 65 years Comparison
Slavs
Basques
$61,709
HOUSEHOLDER INCOME OVER 65 YEARS
68.5/ 100
METRIC RATING
150th/ 347
METRIC RANK
$62,653
HOUSEHOLDER INCOME OVER 65 YEARS
85.4/ 100
METRIC RATING
130th/ 347
METRIC RANK
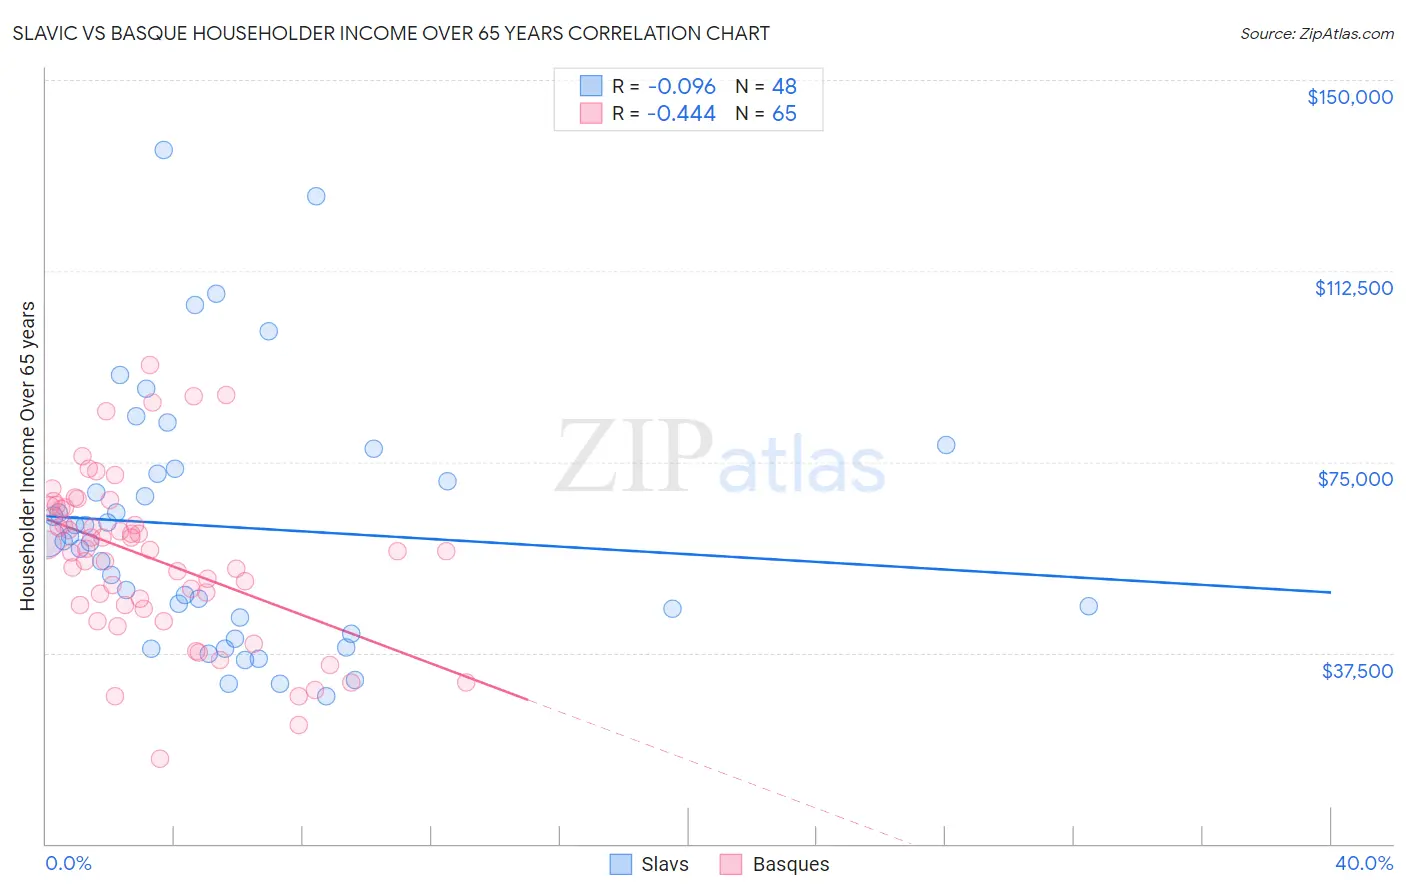
Slavic vs Basque Householder Income Over 65 years Correlation Chart
The statistical analysis conducted on geographies consisting of 270,416,943 people shows a slight negative correlation between the proportion of Slavs and household income with householder over the age of 65 in the United States with a correlation coefficient (R) of -0.096 and weighted average of $61,709. Similarly, the statistical analysis conducted on geographies consisting of 165,583,325 people shows a moderate negative correlation between the proportion of Basques and household income with householder over the age of 65 in the United States with a correlation coefficient (R) of -0.444 and weighted average of $62,653, a difference of 1.5%.
Householder Income Over 65 years Correlation Summary
| Measurement | Slavic | Basque |
| Minimum | $29,063 | $16,667 |
| Maximum | $136,135 | $94,125 |
| Range | $107,072 | $77,458 |
| Mean | $62,217 | $55,918 |
| Median | $59,730 | $57,500 |
| Interquartile 25% (IQ1) | $42,874 | $46,469 |
| Interquartile 75% (IQ3) | $73,140 | $66,222 |
| Interquartile Range (IQR) | $30,267 | $19,753 |
| Standard Deviation (Sample) | $24,786 | $16,196 |
| Standard Deviation (Population) | $24,526 | $16,071 |
Demographics Similar to Slavs and Basques by Householder Income Over 65 years
In terms of householder income over 65 years, the demographic groups most similar to Slavs are Scottish ($61,735, a difference of 0.040%), Alsatian ($61,797, a difference of 0.14%), Immigrants from Nepal ($61,843, a difference of 0.22%), Immigrants from Southern Europe ($61,902, a difference of 0.31%), and Immigrants from Uganda ($61,976, a difference of 0.43%). Similarly, the demographic groups most similar to Basques are Immigrants from Western Asia ($62,645, a difference of 0.010%), Immigrants from Germany ($62,544, a difference of 0.17%), Immigrants from Northern Africa ($62,522, a difference of 0.21%), Immigrants from Brazil ($62,364, a difference of 0.46%), and Immigrants from Chile ($62,354, a difference of 0.48%).
| Demographics | Rating | Rank | Householder Income Over 65 years |
| Basques | 85.4 /100 | #130 | Excellent $62,653 |
| Immigrants | Western Asia | 85.3 /100 | #131 | Excellent $62,645 |
| Immigrants | Germany | 83.9 /100 | #132 | Excellent $62,544 |
| Immigrants | Northern Africa | 83.6 /100 | #133 | Excellent $62,522 |
| Immigrants | Brazil | 81.2 /100 | #134 | Excellent $62,364 |
| Immigrants | Chile | 81.0 /100 | #135 | Excellent $62,354 |
| Alaskan Athabascans | 80.6 /100 | #136 | Excellent $62,330 |
| Immigrants | Syria | 80.2 /100 | #137 | Excellent $62,303 |
| Immigrants | Kazakhstan | 80.0 /100 | #138 | Excellent $62,292 |
| Lebanese | 79.9 /100 | #139 | Good $62,287 |
| Arabs | 79.6 /100 | #140 | Good $62,266 |
| Canadians | 79.0 /100 | #141 | Good $62,230 |
| South American Indians | 78.7 /100 | #142 | Good $62,215 |
| Immigrants | Belarus | 77.8 /100 | #143 | Good $62,162 |
| Immigrants | Peru | 74.4 /100 | #144 | Good $61,988 |
| Immigrants | Uganda | 74.2 /100 | #145 | Good $61,976 |
| Immigrants | Southern Europe | 72.7 /100 | #146 | Good $61,902 |
| Immigrants | Nepal | 71.4 /100 | #147 | Good $61,843 |
| Alsatians | 70.5 /100 | #148 | Good $61,797 |
| Scottish | 69.1 /100 | #149 | Good $61,735 |
| Slavs | 68.5 /100 | #150 | Good $61,709 |