Scotch-Irish vs Basque No Schooling Completed
COMPARE
Scotch-Irish
Basque
No Schooling Completed
No Schooling Completed Comparison
Scotch-Irish
Basques
1.5%
NO SCHOOLING COMPLETED
100.0/ 100
METRIC RATING
14th/ 347
METRIC RANK
1.8%
NO SCHOOLING COMPLETED
97.9/ 100
METRIC RATING
103rd/ 347
METRIC RANK
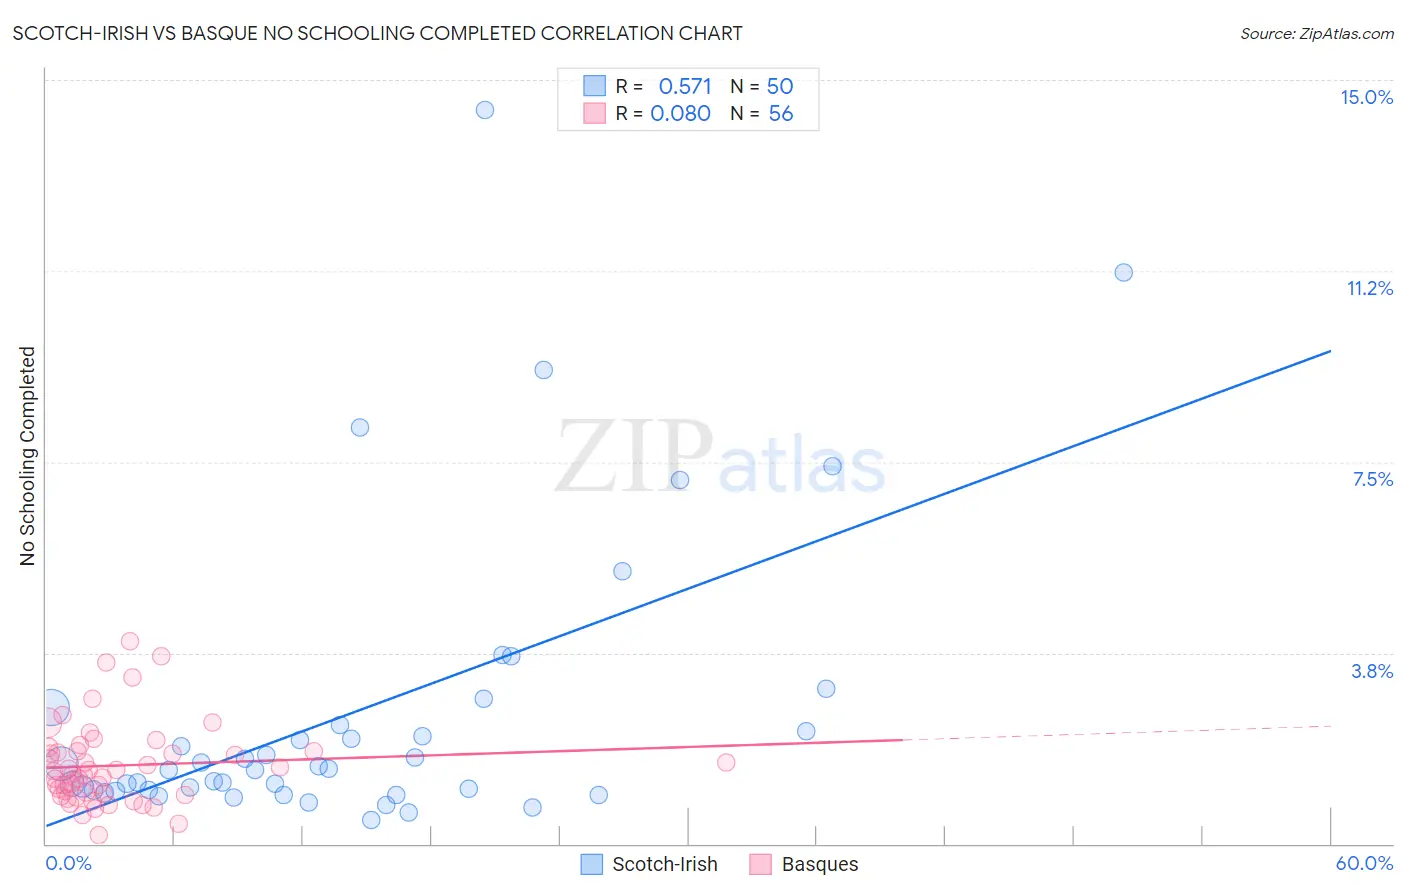
Scotch-Irish vs Basque No Schooling Completed Correlation Chart
The statistical analysis conducted on geographies consisting of 532,641,930 people shows a substantial positive correlation between the proportion of Scotch-Irish and percentage of population with no schooling in the United States with a correlation coefficient (R) of 0.571 and weighted average of 1.5%. Similarly, the statistical analysis conducted on geographies consisting of 164,919,642 people shows a slight positive correlation between the proportion of Basques and percentage of population with no schooling in the United States with a correlation coefficient (R) of 0.080 and weighted average of 1.8%, a difference of 25.6%.
No Schooling Completed Correlation Summary
| Measurement | Scotch-Irish | Basque |
| Minimum | 0.46% | 0.17% |
| Maximum | 14.4% | 4.0% |
| Range | 14.0% | 3.8% |
| Mean | 2.6% | 1.5% |
| Median | 1.5% | 1.4% |
| Interquartile 25% (IQ1) | 1.0% | 0.96% |
| Interquartile 75% (IQ3) | 2.3% | 1.8% |
| Interquartile Range (IQR) | 1.3% | 0.85% |
| Standard Deviation (Sample) | 2.9% | 0.80% |
| Standard Deviation (Population) | 2.9% | 0.79% |
Similar Demographics by No Schooling Completed
Demographics Similar to Scotch-Irish by No Schooling Completed
In terms of no schooling completed, the demographic groups most similar to Scotch-Irish are Tlingit-Haida (1.5%, a difference of 0.060%), Finnish (1.5%, a difference of 0.58%), Croatian (1.5%, a difference of 0.59%), Danish (1.5%, a difference of 0.89%), and Polish (1.4%, a difference of 0.94%).
| Demographics | Rating | Rank | No Schooling Completed |
| English | 100.0 /100 | #7 | Exceptional 1.4% |
| Swedes | 100.0 /100 | #8 | Exceptional 1.4% |
| Scottish | 100.0 /100 | #9 | Exceptional 1.4% |
| Dutch | 100.0 /100 | #10 | Exceptional 1.4% |
| Lithuanians | 100.0 /100 | #11 | Exceptional 1.4% |
| Irish | 100.0 /100 | #12 | Exceptional 1.4% |
| Poles | 100.0 /100 | #13 | Exceptional 1.4% |
| Scotch-Irish | 100.0 /100 | #14 | Exceptional 1.5% |
| Tlingit-Haida | 100.0 /100 | #15 | Exceptional 1.5% |
| Finns | 100.0 /100 | #16 | Exceptional 1.5% |
| Croatians | 100.0 /100 | #17 | Exceptional 1.5% |
| Danes | 100.0 /100 | #18 | Exceptional 1.5% |
| Alaskan Athabascans | 100.0 /100 | #19 | Exceptional 1.5% |
| Welsh | 100.0 /100 | #20 | Exceptional 1.5% |
| Chinese | 100.0 /100 | #21 | Exceptional 1.5% |
Demographics Similar to Basques by No Schooling Completed
In terms of no schooling completed, the demographic groups most similar to Basques are Immigrants from Switzerland (1.8%, a difference of 0.050%), Immigrants from Czechoslovakia (1.8%, a difference of 0.060%), Immigrants from Singapore (1.8%, a difference of 0.35%), Choctaw (1.8%, a difference of 0.55%), and Thai (1.8%, a difference of 0.57%).
| Demographics | Rating | Rank | No Schooling Completed |
| Bhutanese | 98.4 /100 | #96 | Exceptional 1.8% |
| Immigrants | Ireland | 98.4 /100 | #97 | Exceptional 1.8% |
| Iranians | 98.2 /100 | #98 | Exceptional 1.8% |
| Choctaw | 98.1 /100 | #99 | Exceptional 1.8% |
| Immigrants | Singapore | 98.0 /100 | #100 | Exceptional 1.8% |
| Immigrants | Czechoslovakia | 97.9 /100 | #101 | Exceptional 1.8% |
| Immigrants | Switzerland | 97.9 /100 | #102 | Exceptional 1.8% |
| Basques | 97.9 /100 | #103 | Exceptional 1.8% |
| Thais | 97.5 /100 | #104 | Exceptional 1.8% |
| German Russians | 97.5 /100 | #105 | Exceptional 1.8% |
| Immigrants | France | 97.3 /100 | #106 | Exceptional 1.8% |
| Yugoslavians | 97.2 /100 | #107 | Exceptional 1.8% |
| Okinawans | 97.1 /100 | #108 | Exceptional 1.8% |
| Immigrants | Saudi Arabia | 96.8 /100 | #109 | Exceptional 1.9% |
| Immigrants | Latvia | 96.7 /100 | #110 | Exceptional 1.9% |