Pima vs West Indian Unemployment Among Women with Children Under 18 years
COMPARE
Pima
West Indian
Unemployment Among Women with Children Under 18 years
Unemployment Among Women with Children Under 18 years Comparison
Pima
West Indians
11.7%
UNEMPLOYMENT AMONG WOMEN WITH CHILDREN UNDER 18 YEARS
0.0/ 100
METRIC RATING
347th/ 347
METRIC RANK
6.3%
UNEMPLOYMENT AMONG WOMEN WITH CHILDREN UNDER 18 YEARS
0.0/ 100
METRIC RATING
283rd/ 347
METRIC RANK
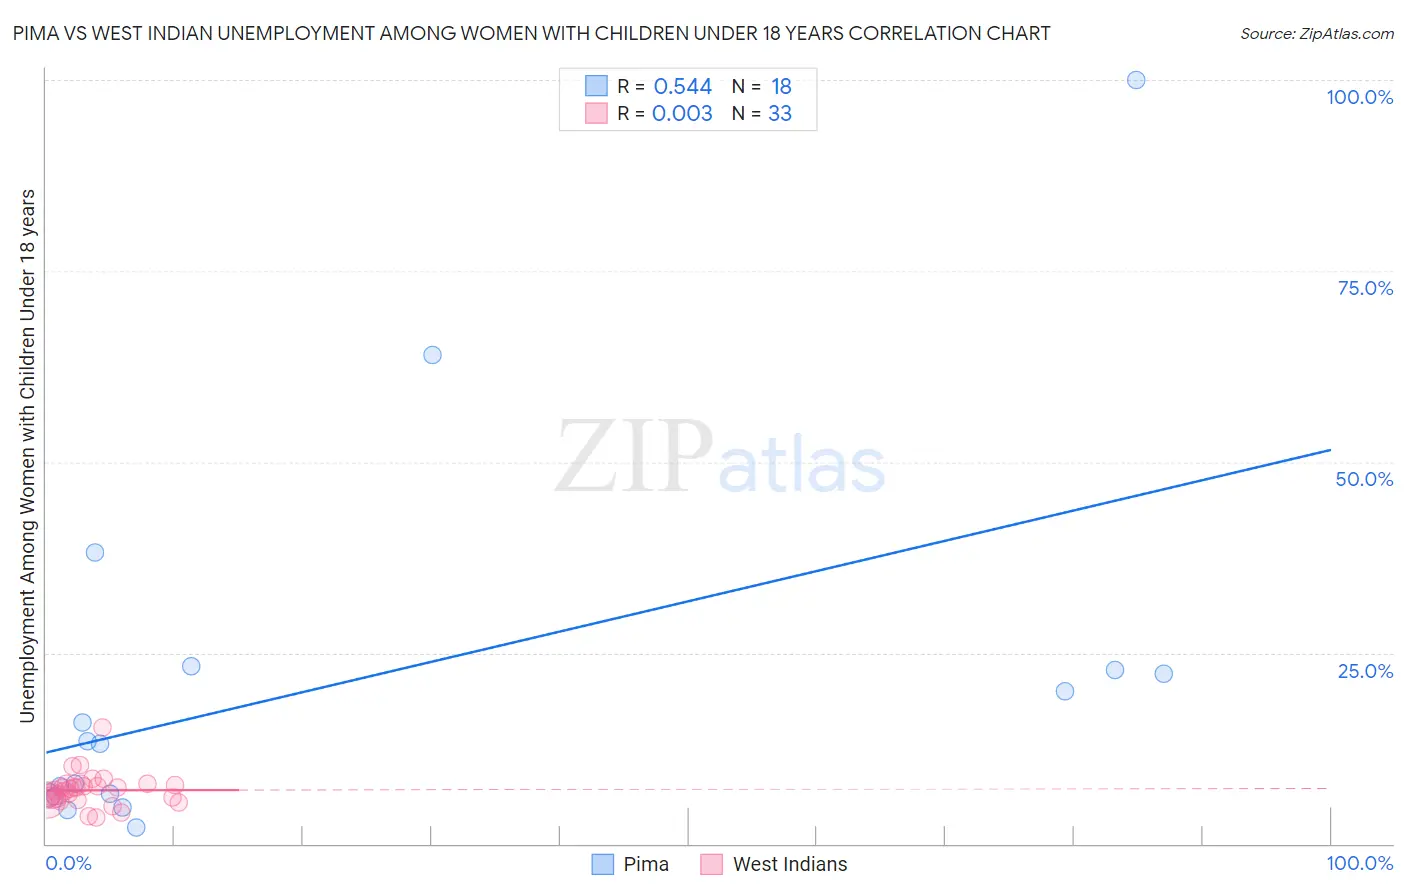
Pima vs West Indian Unemployment Among Women with Children Under 18 years Correlation Chart
The statistical analysis conducted on geographies consisting of 60,829,191 people shows a substantial positive correlation between the proportion of Pima and unemployment rate among women with children under the age of 18 in the United States with a correlation coefficient (R) of 0.544 and weighted average of 11.7%. Similarly, the statistical analysis conducted on geographies consisting of 249,152,144 people shows no correlation between the proportion of West Indians and unemployment rate among women with children under the age of 18 in the United States with a correlation coefficient (R) of 0.003 and weighted average of 6.3%, a difference of 85.3%.
Unemployment Among Women with Children Under 18 years Correlation Summary
| Measurement | Pima | West Indian |
| Minimum | 2.2% | 3.4% |
| Maximum | 100.0% | 15.2% |
| Range | 97.8% | 11.8% |
| Mean | 21.0% | 7.0% |
| Median | 13.2% | 7.0% |
| Interquartile 25% (IQ1) | 6.3% | 5.8% |
| Interquartile 75% (IQ3) | 22.8% | 7.7% |
| Interquartile Range (IQR) | 16.5% | 2.0% |
| Standard Deviation (Sample) | 24.8% | 2.2% |
| Standard Deviation (Population) | 24.1% | 2.1% |
Similar Demographics by Unemployment Among Women with Children Under 18 years
Demographics Similar to Pima by Unemployment Among Women with Children Under 18 years
In terms of unemployment among women with children under 18 years, the demographic groups most similar to Pima are Yup'ik (11.0%, a difference of 6.0%), Yuman (9.8%, a difference of 19.7%), Inupiat (9.6%, a difference of 22.0%), Arapaho (9.2%, a difference of 27.1%), and Puerto Rican (9.0%, a difference of 29.8%).
| Demographics | Rating | Rank | Unemployment Among Women with Children Under 18 years |
| Immigrants | Dominican Republic | 0.0 /100 | #333 | Tragic 7.5% |
| Cheyenne | 0.0 /100 | #334 | Tragic 7.8% |
| Apache | 0.0 /100 | #335 | Tragic 7.9% |
| Sioux | 0.0 /100 | #336 | Tragic 7.9% |
| Yakama | 0.0 /100 | #337 | Tragic 8.1% |
| Immigrants | Yemen | 0.0 /100 | #338 | Tragic 8.2% |
| Navajo | 0.0 /100 | #339 | Tragic 8.2% |
| Crow | 0.0 /100 | #340 | Tragic 8.2% |
| Tohono O'odham | 0.0 /100 | #341 | Tragic 8.9% |
| Puerto Ricans | 0.0 /100 | #342 | Tragic 9.0% |
| Arapaho | 0.0 /100 | #343 | Tragic 9.2% |
| Inupiat | 0.0 /100 | #344 | Tragic 9.6% |
| Yuman | 0.0 /100 | #345 | Tragic 9.8% |
| Yup'ik | 0.0 /100 | #346 | Tragic 11.0% |
| Pima | 0.0 /100 | #347 | Tragic 11.7% |
Demographics Similar to West Indians by Unemployment Among Women with Children Under 18 years
In terms of unemployment among women with children under 18 years, the demographic groups most similar to West Indians are Immigrants from Grenada (6.3%, a difference of 0.030%), Immigrants from St. Vincent and the Grenadines (6.3%, a difference of 0.18%), Bahamian (6.3%, a difference of 0.18%), Immigrants from El Salvador (6.3%, a difference of 0.19%), and Alaskan Athabascan (6.3%, a difference of 0.33%).
| Demographics | Rating | Rank | Unemployment Among Women with Children Under 18 years |
| Immigrants | Ghana | 0.0 /100 | #276 | Tragic 6.2% |
| Mexican American Indians | 0.0 /100 | #277 | Tragic 6.2% |
| Immigrants | Barbados | 0.0 /100 | #278 | Tragic 6.2% |
| Immigrants | Portugal | 0.0 /100 | #279 | Tragic 6.3% |
| Guatemalans | 0.0 /100 | #280 | Tragic 6.3% |
| Immigrants | El Salvador | 0.0 /100 | #281 | Tragic 6.3% |
| Immigrants | St. Vincent and the Grenadines | 0.0 /100 | #282 | Tragic 6.3% |
| West Indians | 0.0 /100 | #283 | Tragic 6.3% |
| Immigrants | Grenada | 0.0 /100 | #284 | Tragic 6.3% |
| Bahamians | 0.0 /100 | #285 | Tragic 6.3% |
| Alaskan Athabascans | 0.0 /100 | #286 | Tragic 6.3% |
| Kiowa | 0.0 /100 | #287 | Tragic 6.3% |
| Cree | 0.0 /100 | #288 | Tragic 6.3% |
| Immigrants | Caribbean | 0.0 /100 | #289 | Tragic 6.4% |
| Blackfeet | 0.0 /100 | #290 | Tragic 6.4% |