Guatemalan vs West Indian Median Female Earnings
COMPARE
Guatemalan
West Indian
Median Female Earnings
Median Female Earnings Comparison
Guatemalans
West Indians
$35,695
MEDIAN FEMALE EARNINGS
0.0/ 100
METRIC RATING
293rd/ 347
METRIC RANK
$40,317
MEDIAN FEMALE EARNINGS
78.4/ 100
METRIC RATING
152nd/ 347
METRIC RANK
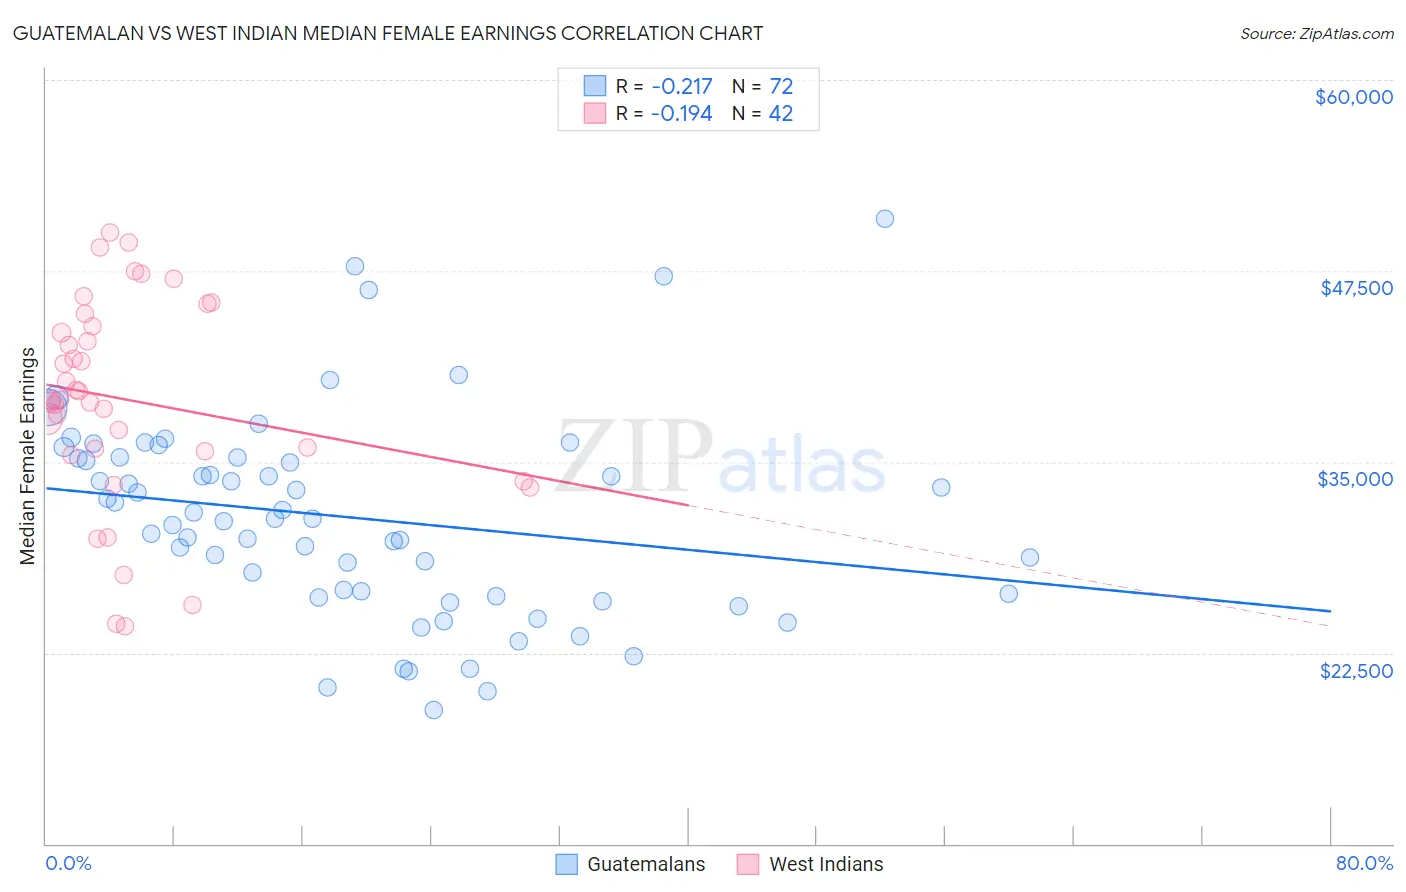
Guatemalan vs West Indian Median Female Earnings Correlation Chart
The statistical analysis conducted on geographies consisting of 409,414,975 people shows a weak negative correlation between the proportion of Guatemalans and median female earnings in the United States with a correlation coefficient (R) of -0.217 and weighted average of $35,695. Similarly, the statistical analysis conducted on geographies consisting of 253,995,323 people shows a poor negative correlation between the proportion of West Indians and median female earnings in the United States with a correlation coefficient (R) of -0.194 and weighted average of $40,317, a difference of 13.0%.
Median Female Earnings Correlation Summary
| Measurement | Guatemalan | West Indian |
| Minimum | $18,750 | $24,276 |
| Maximum | $50,917 | $50,049 |
| Range | $32,167 | $25,773 |
| Mean | $31,367 | $39,058 |
| Median | $31,263 | $39,050 |
| Interquartile 25% (IQ1) | $26,284 | $35,688 |
| Interquartile 75% (IQ3) | $35,245 | $43,912 |
| Interquartile Range (IQR) | $8,961 | $8,224 |
| Standard Deviation (Sample) | $6,641 | $6,683 |
| Standard Deviation (Population) | $6,594 | $6,603 |
Similar Demographics by Median Female Earnings
Demographics Similar to Guatemalans by Median Female Earnings
In terms of median female earnings, the demographic groups most similar to Guatemalans are Cheyenne ($35,673, a difference of 0.060%), Comanche ($35,661, a difference of 0.090%), Mexican American Indian ($35,629, a difference of 0.19%), American ($35,777, a difference of 0.23%), and Blackfeet ($35,864, a difference of 0.47%).
| Demographics | Rating | Rank | Median Female Earnings |
| Osage | 0.0 /100 | #286 | Tragic $36,034 |
| Immigrants | Nicaragua | 0.0 /100 | #287 | Tragic $36,023 |
| Immigrants | Zaire | 0.0 /100 | #288 | Tragic $36,017 |
| Bangladeshis | 0.0 /100 | #289 | Tragic $35,960 |
| Central American Indians | 0.0 /100 | #290 | Tragic $35,930 |
| Blackfeet | 0.0 /100 | #291 | Tragic $35,864 |
| Americans | 0.0 /100 | #292 | Tragic $35,777 |
| Guatemalans | 0.0 /100 | #293 | Tragic $35,695 |
| Cheyenne | 0.0 /100 | #294 | Tragic $35,673 |
| Comanche | 0.0 /100 | #295 | Tragic $35,661 |
| Mexican American Indians | 0.0 /100 | #296 | Tragic $35,629 |
| Hmong | 0.0 /100 | #297 | Tragic $35,498 |
| Immigrants | Micronesia | 0.0 /100 | #298 | Tragic $35,477 |
| Immigrants | Guatemala | 0.0 /100 | #299 | Tragic $35,444 |
| Yuman | 0.0 /100 | #300 | Tragic $35,377 |
Demographics Similar to West Indians by Median Female Earnings
In terms of median female earnings, the demographic groups most similar to West Indians are British West Indian ($40,299, a difference of 0.040%), Immigrants from Oceania ($40,297, a difference of 0.050%), Immigrants from Armenia ($40,340, a difference of 0.060%), Immigrants from Cameroon ($40,354, a difference of 0.090%), and Immigrants from Chile ($40,353, a difference of 0.090%).
| Demographics | Rating | Rank | Median Female Earnings |
| Brazilians | 83.6 /100 | #145 | Excellent $40,483 |
| Ghanaians | 82.1 /100 | #146 | Excellent $40,429 |
| Vietnamese | 80.4 /100 | #147 | Excellent $40,377 |
| Poles | 80.2 /100 | #148 | Excellent $40,371 |
| Immigrants | Cameroon | 79.7 /100 | #149 | Good $40,354 |
| Immigrants | Chile | 79.6 /100 | #150 | Good $40,353 |
| Immigrants | Armenia | 79.2 /100 | #151 | Good $40,340 |
| West Indians | 78.4 /100 | #152 | Good $40,317 |
| British West Indians | 77.7 /100 | #153 | Good $40,299 |
| Immigrants | Oceania | 77.6 /100 | #154 | Good $40,297 |
| Immigrants | Africa | 76.2 /100 | #155 | Good $40,257 |
| Peruvians | 75.3 /100 | #156 | Good $40,234 |
| Portuguese | 73.0 /100 | #157 | Good $40,177 |
| Immigrants | Senegal | 72.2 /100 | #158 | Good $40,157 |
| Immigrants | Vietnam | 72.0 /100 | #159 | Good $40,153 |