Aleut vs West Indian Median Female Earnings
COMPARE
Aleut
West Indian
Median Female Earnings
Median Female Earnings Comparison
Aleuts
West Indians
$38,719
MEDIAN FEMALE EARNINGS
11.6/ 100
METRIC RATING
211th/ 347
METRIC RANK
$40,317
MEDIAN FEMALE EARNINGS
78.4/ 100
METRIC RATING
152nd/ 347
METRIC RANK
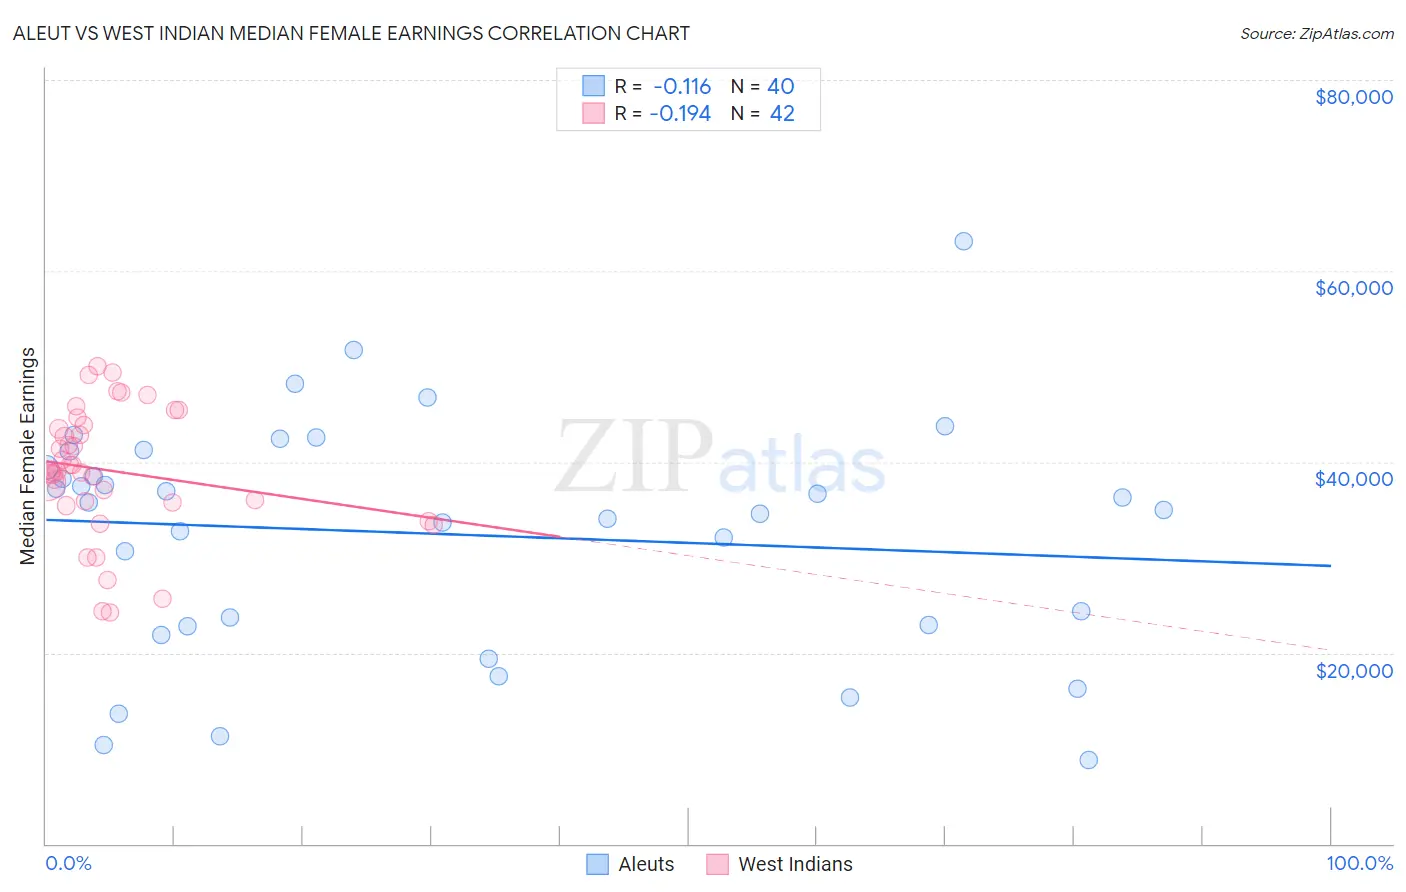
Aleut vs West Indian Median Female Earnings Correlation Chart
The statistical analysis conducted on geographies consisting of 61,761,178 people shows a poor negative correlation between the proportion of Aleuts and median female earnings in the United States with a correlation coefficient (R) of -0.116 and weighted average of $38,719. Similarly, the statistical analysis conducted on geographies consisting of 253,995,323 people shows a poor negative correlation between the proportion of West Indians and median female earnings in the United States with a correlation coefficient (R) of -0.194 and weighted average of $40,317, a difference of 4.1%.
Median Female Earnings Correlation Summary
| Measurement | Aleut | West Indian |
| Minimum | $8,750 | $24,276 |
| Maximum | $63,125 | $50,049 |
| Range | $54,375 | $25,773 |
| Mean | $32,459 | $39,058 |
| Median | $35,345 | $39,050 |
| Interquartile 25% (IQ1) | $22,835 | $35,688 |
| Interquartile 75% (IQ3) | $40,258 | $43,912 |
| Interquartile Range (IQR) | $17,423 | $8,224 |
| Standard Deviation (Sample) | $12,271 | $6,683 |
| Standard Deviation (Population) | $12,117 | $6,603 |
Similar Demographics by Median Female Earnings
Demographics Similar to Aleuts by Median Female Earnings
In terms of median female earnings, the demographic groups most similar to Aleuts are Guamanian/Chamorro ($38,717, a difference of 0.010%), Czechoslovakian ($38,738, a difference of 0.050%), Jamaican ($38,670, a difference of 0.13%), Iraqi ($38,666, a difference of 0.14%), and Spaniard ($38,656, a difference of 0.16%).
| Demographics | Rating | Rank | Median Female Earnings |
| Immigrants | Uruguay | 17.3 /100 | #204 | Poor $38,945 |
| Immigrants | Colombia | 16.3 /100 | #205 | Poor $38,913 |
| Immigrants | Bosnia and Herzegovina | 15.6 /100 | #206 | Poor $38,886 |
| Immigrants | Cambodia | 14.2 /100 | #207 | Poor $38,833 |
| Immigrants | Thailand | 13.6 /100 | #208 | Poor $38,810 |
| Norwegians | 13.4 /100 | #209 | Poor $38,802 |
| Czechoslovakians | 12.0 /100 | #210 | Poor $38,738 |
| Aleuts | 11.6 /100 | #211 | Poor $38,719 |
| Guamanians/Chamorros | 11.5 /100 | #212 | Poor $38,717 |
| Jamaicans | 10.5 /100 | #213 | Poor $38,670 |
| Iraqis | 10.5 /100 | #214 | Poor $38,666 |
| Spaniards | 10.3 /100 | #215 | Poor $38,656 |
| Immigrants | Ecuador | 10.1 /100 | #216 | Poor $38,644 |
| Immigrants | Jamaica | 9.7 /100 | #217 | Tragic $38,625 |
| Cape Verdeans | 9.5 /100 | #218 | Tragic $38,614 |
Demographics Similar to West Indians by Median Female Earnings
In terms of median female earnings, the demographic groups most similar to West Indians are British West Indian ($40,299, a difference of 0.040%), Immigrants from Oceania ($40,297, a difference of 0.050%), Immigrants from Armenia ($40,340, a difference of 0.060%), Immigrants from Cameroon ($40,354, a difference of 0.090%), and Immigrants from Chile ($40,353, a difference of 0.090%).
| Demographics | Rating | Rank | Median Female Earnings |
| Brazilians | 83.6 /100 | #145 | Excellent $40,483 |
| Ghanaians | 82.1 /100 | #146 | Excellent $40,429 |
| Vietnamese | 80.4 /100 | #147 | Excellent $40,377 |
| Poles | 80.2 /100 | #148 | Excellent $40,371 |
| Immigrants | Cameroon | 79.7 /100 | #149 | Good $40,354 |
| Immigrants | Chile | 79.6 /100 | #150 | Good $40,353 |
| Immigrants | Armenia | 79.2 /100 | #151 | Good $40,340 |
| West Indians | 78.4 /100 | #152 | Good $40,317 |
| British West Indians | 77.7 /100 | #153 | Good $40,299 |
| Immigrants | Oceania | 77.6 /100 | #154 | Good $40,297 |
| Immigrants | Africa | 76.2 /100 | #155 | Good $40,257 |
| Peruvians | 75.3 /100 | #156 | Good $40,234 |
| Portuguese | 73.0 /100 | #157 | Good $40,177 |
| Immigrants | Senegal | 72.2 /100 | #158 | Good $40,157 |
| Immigrants | Vietnam | 72.0 /100 | #159 | Good $40,153 |